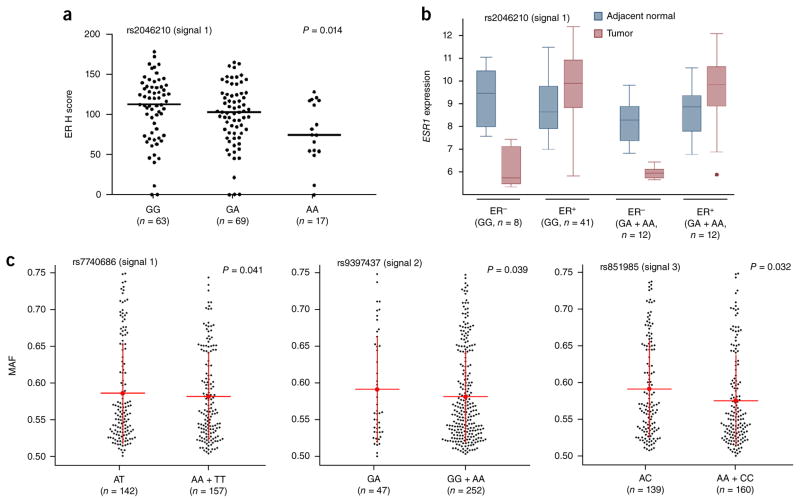
Figure 2.
ER expression and allelic imbalance correlate with signal 1 SNPs. (a) Negative correlation between the signal 1 SNP rs2046210 and ER protein expression. Black dots represent ER expression from individual samples measured by immunohistochemistry (H score). Horizontal lines represent the mean H score for each genotype. The P value was calculated using a Spearman rank correlation test. (b) Box plots of ESR1 gene expression (log2 transformed) in breast tumor and adjacent normal samples. Boxes extend from the 25th to the 75th percentile, horizontal bars represent the median, whiskers indicate the full range of ESR1 expression and outliers are represented as circles. (c) Allelic imbalance in ESR1 expression by genotypic status at breast cancer risk variants. Data are classified according to the genotypes at risk SNPs (heterozygous versus homozygous). Black dots represent the average major allele fraction of the marker SNPs across ESR1 for an individual from TCGA with breast cancer. Red lines and whiskers correspond to means ± 1 s.d. For rs7740686 (signal 1) and rs9397437 (signal 2), Levene’s test (equality of variances) was used to calculate the P values; for rs851985 (signal 3), a two-tailed t test (equality of means) was used to calculate the P value.

