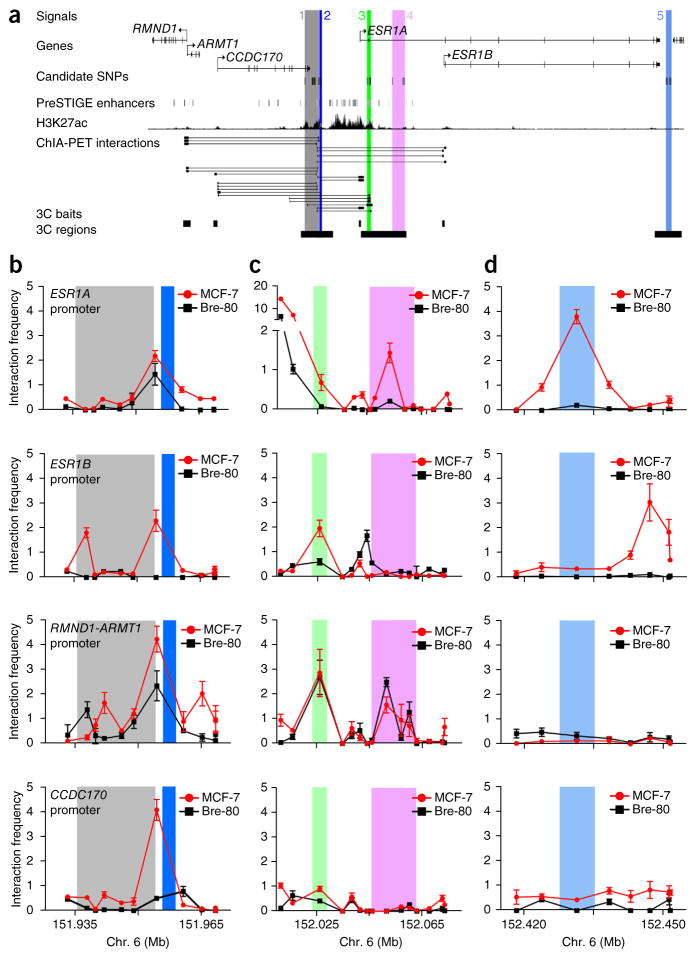
Figure 3.
Chromatin interactions across the 6q25.1 risk region. (a) Signals 1–5 are numbered and shown as colored stripes. RMND1, ARMT1, CCDC170 and ESR1 gene structures are depicted with exons (vertical bars) joined by introns (lines). Gene-enhancer predictions from PreSTIGE12, ChIP-seq binding profiles for H3K27ac13 and Encyclopedia of DNA Elements (ENCODE) RNA polymerase II ChIA-PET interactions in MCF-7 cells are shown. (b–d) 3C anchor points (3C baits) and interrogated sequences (3C regions) are depicted as black boxes and gray shading, respectively. 3C interaction profiles in ER+ MCF-7 and ER− Bre-80 breast cell lines are shown for signals 1 and 2 (b), signals 3 and 4 (c) and signal 5 (d). 3C libraries were generated with EcoRI, with the anchor point set at the ESR1, RMND1-ARMT1 or CCDC170 promoter region. Graphs present the results from three biological replicates; error bars, s.d.

