Figure 4.
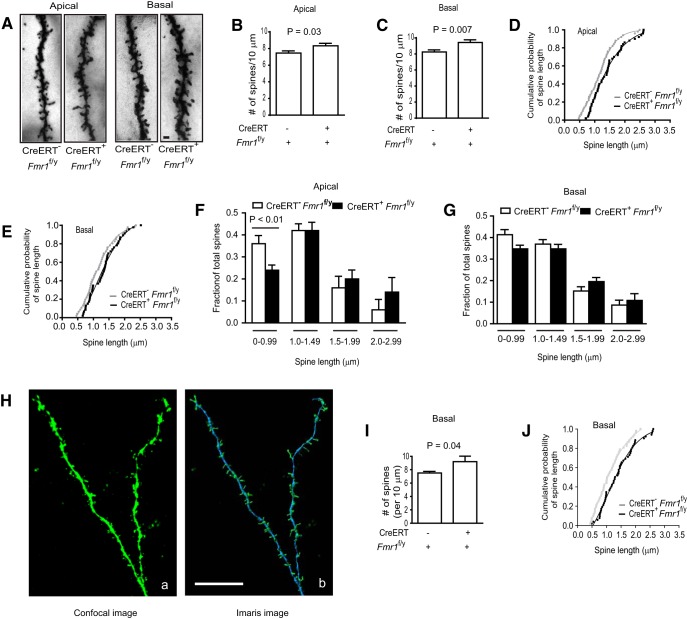
Dendritic spine morphology and density in cortical pyramidal neurons of astrocyte-specific cKO mice. A, Representative apical and basal dendrites from cortical layers 2/3 of CreERT− Fmr1f/y and CreERT+ Fmr1f/y mice illustrated by Golgi staining. Scale bar, 2.5 μm. B, C, Spine density of apical (B) and basal (C) dendrites from CreERT− Fmr1f/y and CreERT+ Fmr1f/y cortical neurons; n = 23–24 dendrites/group from four mice. D, E, Cumulative probability curves of apical (D) and basal (E) spine length from CreERT− Fmr1f/y and CreERT+ Fmr1f/y cortical neurons; n = 46–50 spines from four mice per group. F, G, Length distribution of apical (F) and basal (G) spines of cortical pyramidal neurons from CreERT− Fmr1f/y and CreERT+ Fmr1f/y mice; n = 46–50 spines from four mice per group. H, Representative confocal and filament tracing Imaris images of basal dendritic spines of cortical pyramidal neuron dye-filled with neurobiotin-488 tracer. Scale bar, 10 μm. I, Quantification of basal dendritic spines of dye-filled cortical neurons from CreERT− Fmr1f/y and CreERT+ Fmr1f/y mice; n = 6 dye-filled dendrites/group. J, Cumulative probability curves of basal spine length from dye-filled pyramidal neurons of CreERT− Fmr1f/y and CreERT+ Fmr1f/y cortical slices; n = 52 spines from four mice per group. The p values were calculated using the Student's t test and two-way ANOVA with post hoc Bonferroni's test.

