Figure 8.
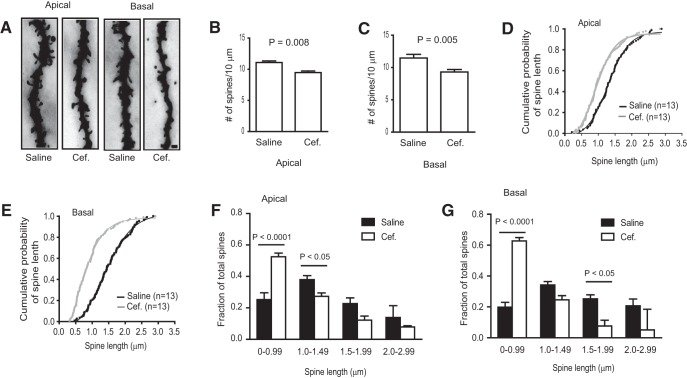
Pharmacological upregulation of functional GLT1 expression corrects spine abnormalities in cortex of Fmr1 KO mice. A, Representative apical and basal dendrites from cortical layer 2/3 of saline- or Cef-injected Fmr1 KO cortical slices illustrated by Golgi staining. Scale bar, 2.5 μm. B, C, Spine density of apical (B) and basal (C) dendrites from saline- or Cef-injected Fmr1 KO cortical neurons; n = 13 dendrites from four mice per group. D, E, Cumulative probability curve of apical (D) and basal (E) spine length from saline- or Cef-injected Fmr1 KO cortical neurons; n = 79–140 spines from four mice per group. Both the trend line and individual sample points are shown on cumulative probability curve. F, G, Length distribution of apical (F) and basal (G) spines of cortical pyramidal neurons in saline- and Cef-injected Fmr1 KO mice; n = 79–140 spines from four mice per group. The p values were determined using the Student's t test, two-way ANOVA, and post hoc Bonferroni's test.

