Figure 4.
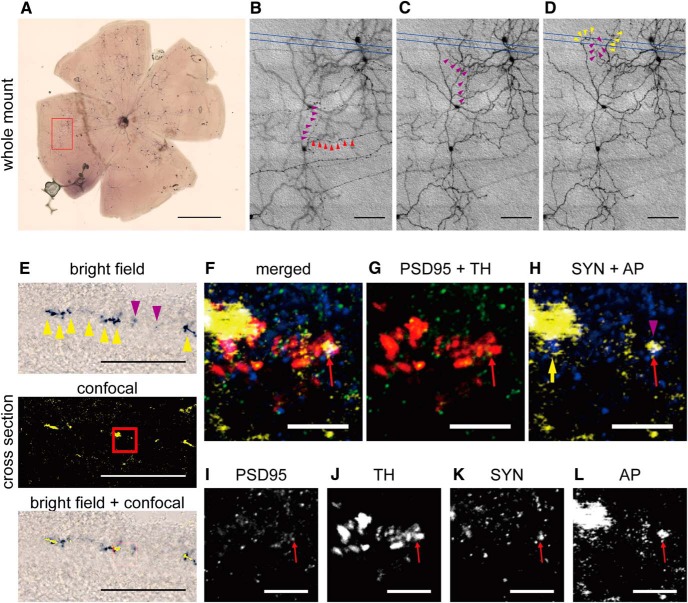
Representative image for colocalization of an ipRGC axon collateral, DAC, presynaptic marker, and postsynaptic marker in the IPL. A, Alkaline phosphatase staining in a whole-mount retina isolated from an Opn4CETL/+;Rosa26IAP/+ mouse, in which ipRGCs were sparsely labeled to identify axon collaterals. B–D, Consecutive DIC images of the axon collateral from the red box in A are shown in high magnification. An ipRGC axon collateral (magenta arrowheads) branched from the primary axon (red arrowheads in B). Dendrites from an ipRGC near the axon collateral are indicated by yellow arrowheads (D). Putative synaptic sites were further investigated by sectioning the retina between the blue lines. E, Bright-field image of NBT/BCIP staining of an ipRGC axon collateral (top) and a confocal image obtained from the same slice using 633 nm reflection mode (center). The merged image (bottom) shows a similar pattern, although the confocal image was much clearer than the bright-field image. Yellow arrowheads indicate dendrites and magenta arrowheads indicate part of an axon collateral. F–L, High-magnification confocal images from the red square in E at the boundary of the IPL. Red arrow indicates the colocalization of the postsynaptic marker PSD-95 (green; I), a TH+ DAC (red; J), the presynaptic marker synaptophysin (yellow; K), and the 633 nm reflection signal from NBT deposition of an axon collateral (blue; L). In H, a yellow arrow indicates an ipRGC dendrite and a magenta arrowhead denotes axon collateral. SYN, Synaptophysin; AP, alkaline phosphatase. Scale bars: A, 1000 μm; B–E, 100 μm; F–L, 10 μm.

