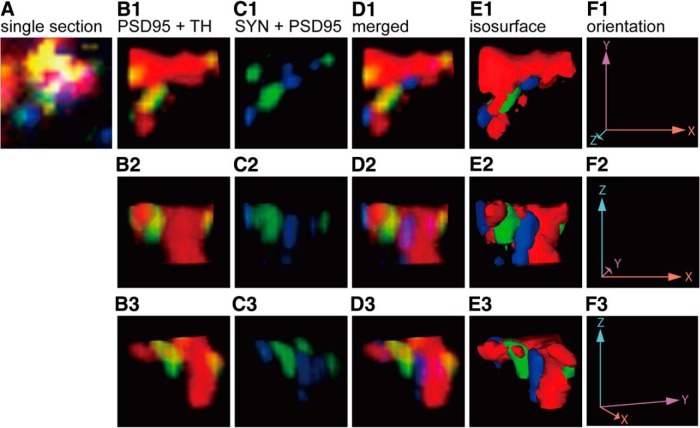
Figure 5.
High-resolution 3D reconstruction of confocal imaging of a single contact between an ipRGC axon collateral and a DAC. A, Cropped image from Figure 4F used to indicate the location and orientation of the synaptic site between an ipRGC axon collateral and a DAC dendrite. B–D, Volume rendered 3D image from a 29 stack confocal image with a 0.08 μm interval. Colocalization (yellow) of a TH+ DAC process (red) and PSD-95 (green) is observed in three orthogonal angles (B1–B3) while synaptophysin (blue) is in contact with PSD-95 (C1–C3). Synaptophysin puncta were not within the DAC dendrite (D1–D3). E, 3D rendering of the image with an opaque isosurface view from three different angles (E1–E3) clearly shows that PSD-95 and synaptophysin puncta are in direct contact. F, Representation of the three orthogonal views with X, Y, and Z axes (F1–F3) as orientation markers.

