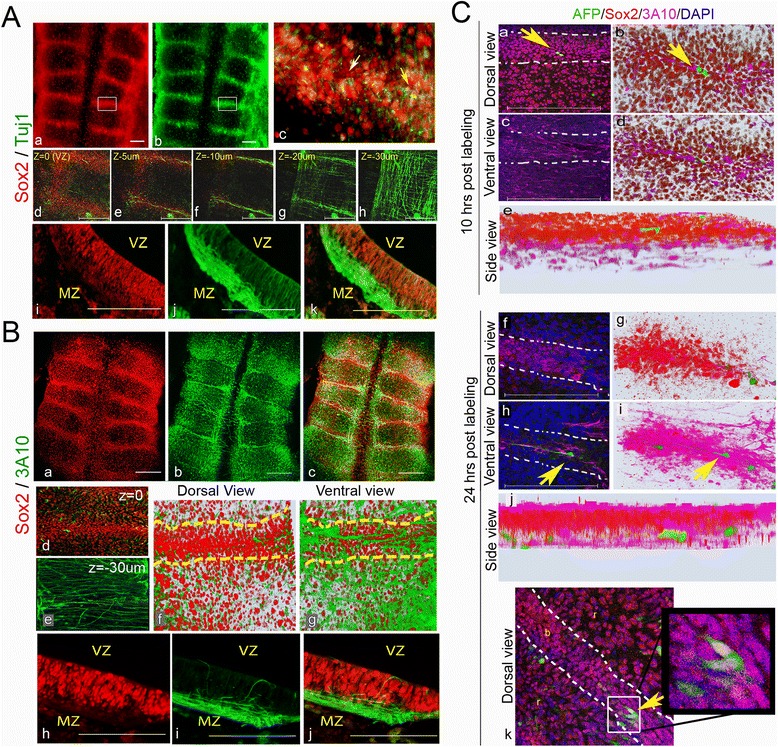
Fig. 4.

Neural differentiation at hindbrain boundaries. A Representative 18HH hindbrains immunostained for Sox2 and Tuj1 (n = 15). Flat-mounted views; high magnification of a boundary area marked in (a,b) is presented as a merged image in (c). Yellow and white arrows indicate a cell stained for both markers or for Sox2 alone, respectively. Sequential confocal Z-stack views from 0 to –30 μm of a boundary region (d–h). Transverse section of a boundary region shown in single (i,j) or merged (k) channels. B Representative 18HH hindbrains immunostained for Sox2 and 3A10 (n = 10). Flat-mounted views of single (a,b) or merged (c) channels. Confocal Z-stack merged channel images of a boundary at 0 (d) and –30 μm (e). 3D plots of boundary/rhombomere region from a merge channel images of dorsal (f) and ventral views (g) obtained from a confocal scan of 30 μm. Transverse section of a boundary region shown in single (h,i) or merged (j) channels. C Clonal analysis of AFP-injected boundary cells. Embryos (n = 10) were harvested 10 h (a–e) or 24 h (f–k) after treatment, stained for Sox2 and DAPI and analyzed as flat-mounts by confocal Z-stack images. Representative (a,b,f,g,k) dorsal views; (c–d,h–i) ventral views; (e,j) side views. (b,d,e,g,i,j) 3D models constructed from 30 Z-stacks shown in dorsal or ventral views, respectively. Yellow arrows indicate AFP+ cells. Dashed lines in B(f,g), C(a,c,f,h,k) indicates boundary–rhombomere intersection. VZ = ventricular zone, MZ = mantle zone, r = rhombomere, b = boundary. Scale bars = 100 μm
