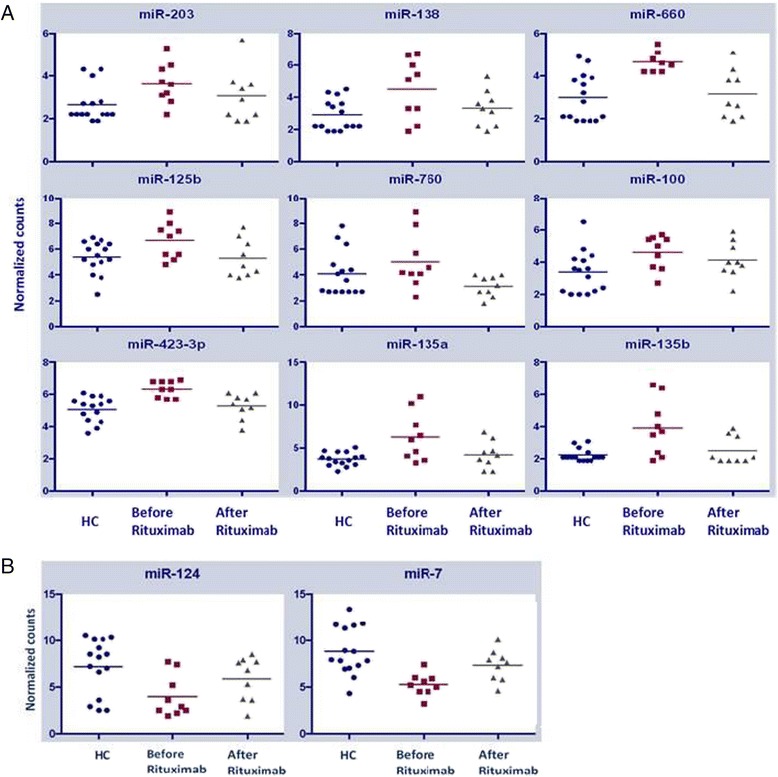
Fig. 1.

Differential miRNA expression between healthy controls and NMO patients before and following rituximab therapy. RNA was extracted from whole blood of 15 healthy controls and nine NMO patients before and after rituximab therapy, and miRNAs were quantified using deep sequencing. The results of nine of the 10 miRNAs which revert to normal levels following rituximab therapy are presented in the figure as normalized counts (logarithmic scale). Healthy controls, NMO patients before rituximab therapy and NMO patients after therapy are marked as blue circles, dark red squares , and grey triangles, respectively
