
Fig. 4.
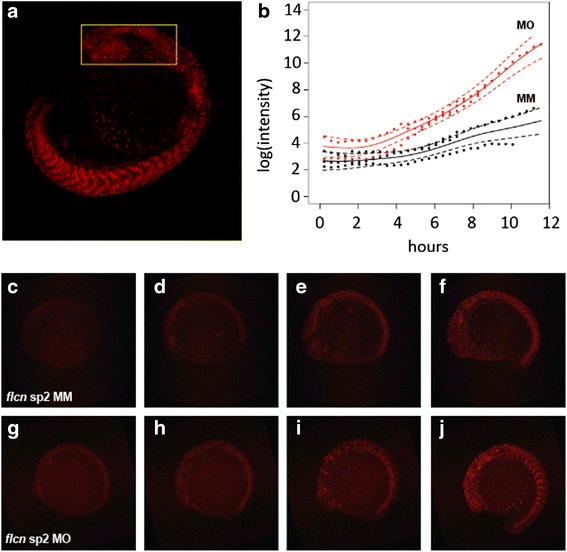
Cell cycle defects in flcn morphant embryos during somitogenesis. a Zebrafish Fucci embryo showing fluorescence for Cdt1-Kusabira Orange2 (G1 phase) with analysed region of the head indicated by yellow box. b Longitudinal time courses of log(intensity) of pixels from 3 flcn splice 2 mismatch morpholino and 4 flcn splice 2 morpholino injected embryos. Frames were taken at 22 min and 36 s intervals from bud stage for flcn splice 2 mismatch morpholino and 2-somite stage for flcn splice 2 morpholino injected embryos. Red data points represent flcn sp2 morpholino (MO) injected embryos; black data points represent mismatch control morpholino (MM) injected embryos. Solid lines indicate estimated mean trajectories for each treatment group, with dashed lines denoting parameter 95 % confidence intervals. c Bud stage, (d) 2-somite stage, (e) 4-somite stage, (f) 10-somite stage flcn splice 2 mismatch control morpholino injected embryos. g 2-somite stage, (h) 4-somite stage, i 6-somite stage, (j) 10-somite stage flcn splice 2 morpholino injected embryos