
Fig. 7.
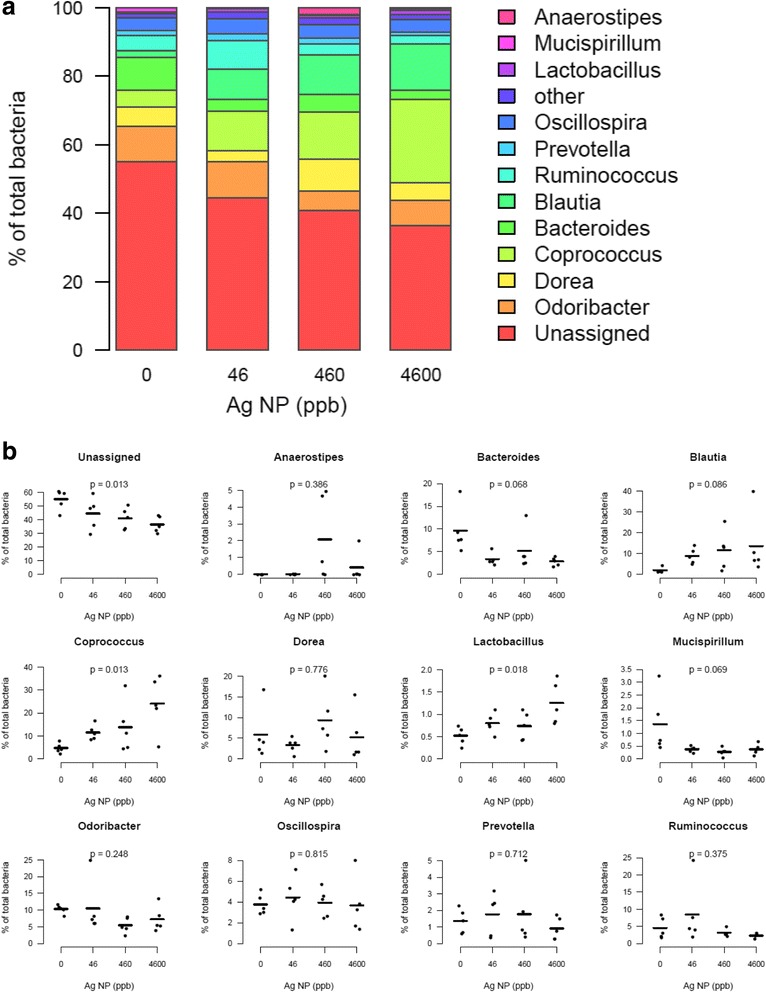
Abundance of bacterial genera in the gut microbiota after exposure to Ag NP. a Relative abundance of the main genera averaged for each group of Ag NP dose (0, 46, 460, 4600 ppb). b Scatter plots obtained for the most abundant genera (average relative abundance ≥ 1 % in at least one group). P-values were obtained with a linear trend test and adjusted with Benjamini-Hochberg method to control FDR (n = 5)