Fig. 7.

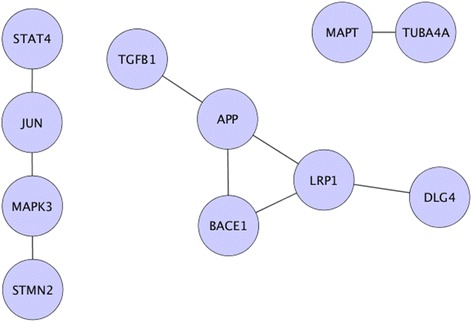
Extracted sub-networks from AD PPIs network. This figure symbolizes the diseased sub-graphs that were generated using prioritized candidates and their differentially expressed neighbors

Extracted sub-networks from AD PPIs network. This figure symbolizes the diseased sub-graphs that were generated using prioritized candidates and their differentially expressed neighbors