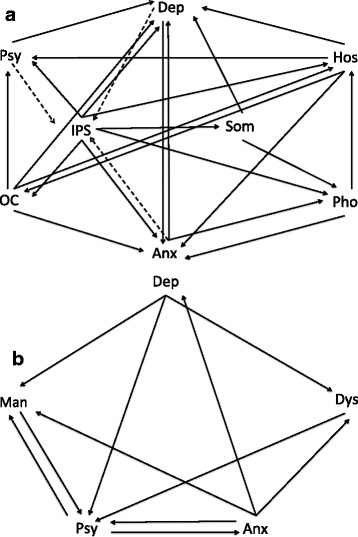
Fig. 1.

The impact of environmental exposure on connectivity across the symptom network. Fig. 1 (a) represents the EDSP sample. Fig. 1 (b) represents the NEMESIS-I sample. Arrows point out the direction of the association (from independent variable to dependent variable). Solid line indicates an increased association between symptom dimensions as a function of the degree of the environmental exposure. Dashed line indicates a reduced association between symptom dimensions as a function of the degree of the environmental exposure. Anx, Anxiety; Dep, Depression; Dys, Dysthmia; Hos, Hostility; IPS, Interpersonal Sensitivity; Man, Mania; OC, Obsessive-Compulsive; Pho, Phobic anxiety; Psy, Psychosis; Som, Somatization
