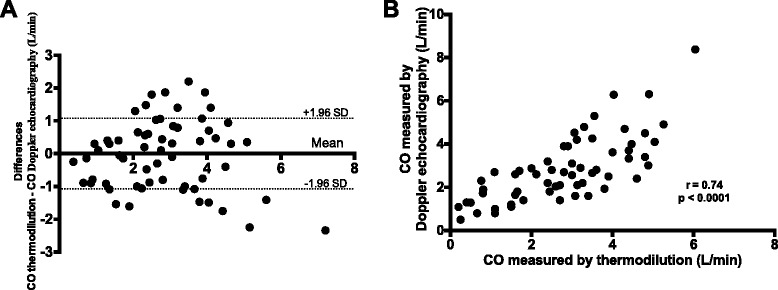
Fig. 3.

a Bland-Altman plot, difference vs. the average right cardiac output measured by thermodilution compared to the Doppler echocardiography method (L/min), b Correlation between right cardiac output measured by the thermodilution and the Doppler echocardiography method. CO, cardiac output, r, Pearson correlation coefficient
