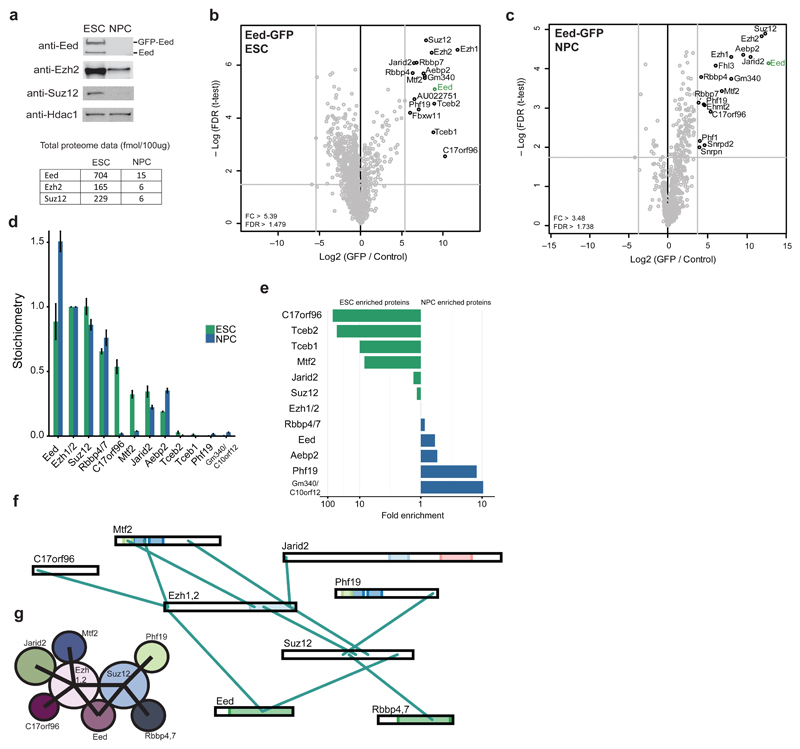
Figure 1. PRC2 interactors and architecture during stem cell differentiation.
(a) Western blot (top) of core PRC2 members on nuclear extracts from ESCs and NPCs. Hdac1 is used as a loading control. Uncropped blots appear in Supplementary Data Set 1. The bottom table lists the absolute abundance of Eed, Ezh2 and Suz12 in nuclear extracts from each cell type24. (b,c) Volcano plots from label-free GFP pulldowns on Eed-GFP ESC (b) and NPC (c) nuclear extracts. Statistically enriched proteins in the Eed-GFP pulldown are identified by a permutation-based FDR-corrected t-test. The label-free quantification (LFQ) intensity of the GFP pulldown relative to the control [fold change (FC), x-axis] is plotted against the -log10-transformed P-value of the t-test (y-axis). Dotted grey lines represent statistical cutoffs. The proteins in the upper right corner represent the bait (Eed, green) and its interactors. Snrpn, Snrpd2, and Fhl3 are known GFP contaminants. (d) Stoichiometry of Eed-GFP interactors in ESCs and NPCs. The iBAQ value of each protein group is divided by the iBAQ value of the core PRC2 subunits Ezh1 and 2, then graphed with Ezh1 and 2 set to 1. Data are shown as mean ± s.d. (n = 3 pulldowns). (e) Logarithmic plot of the ratio of ESC enrichment (left) or NPC enrichment (right) for Eed-GFP interacting proteins. (f) Visualization of cross-links identified from single affinity purified Eed-GFP in ESCs. Ambiguous cross-links between paralogous subunits (Rbbp4 and 7, Ezh1 and 2) are combined in this visualization. (g) Summary of PRC2 architecture in mESCs based on cross-links from (f).

