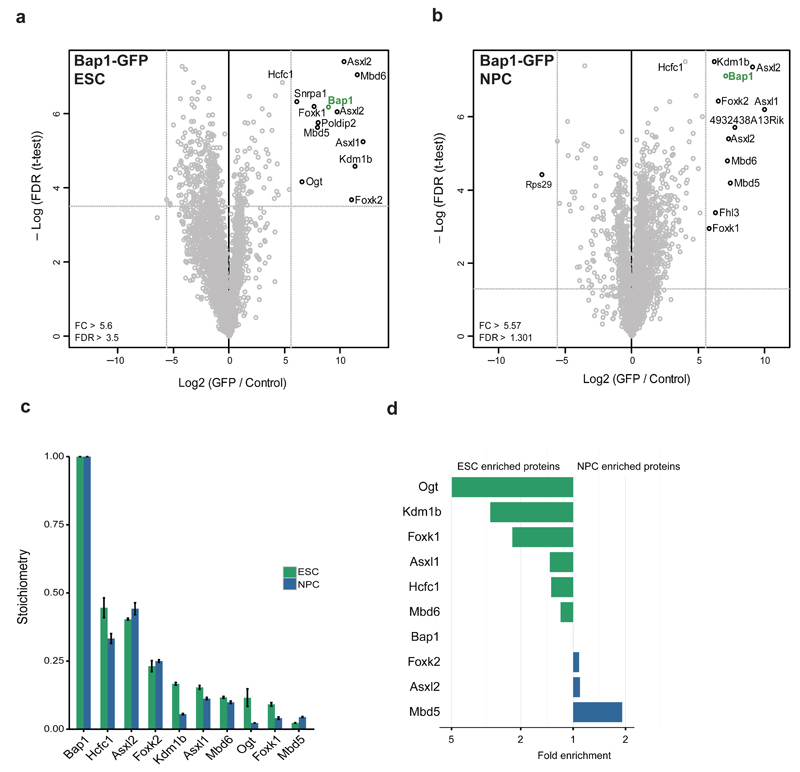
Figure 3. PR-DUB interactors during stem cell differentiation.
(a,b) Volcano plots from label-free GFP pulldowns on Bap1-GFP ESC (a) and NPC (b) nuclear extracts graphed as in Fig. 1b. Snrpa1 and Fhl3 are known GFP contaminants. (c) Stoichiometry of Bap1-GFP interactors in mESCs and NPCs. The iBAQ value of each protein group is divided by the iBAQ value of Bap1, then graphed with Bap1 set to 1. Data are shown as mean ± s.d. (n = 3 pulldowns). (d) Plot of the ratio of ESC enrichment (left) or NPC enrichment (right) for Bap1-GFP interacting proteins.

