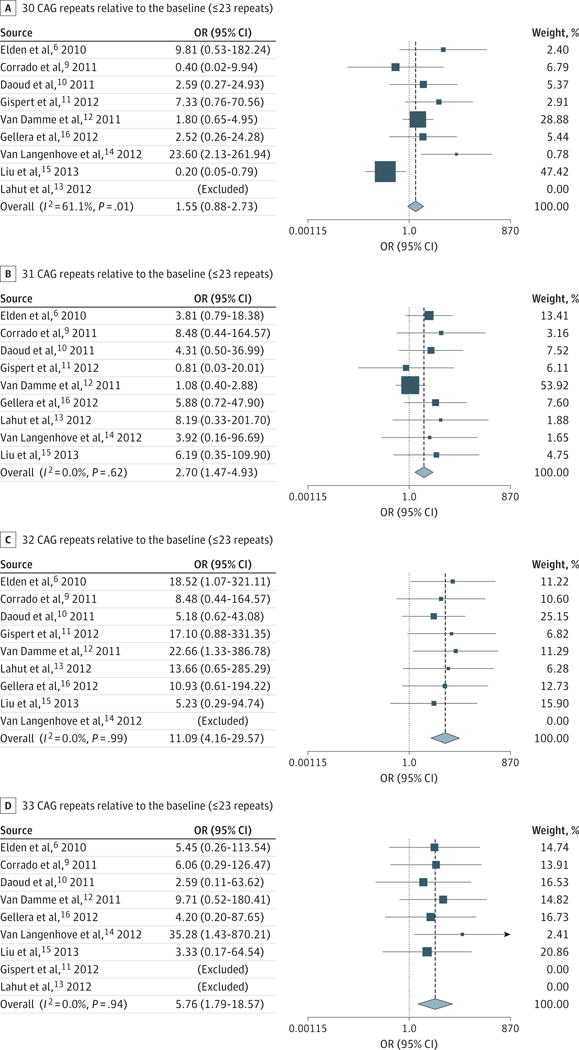
Figure 2. Odds Ratios (ORs) for Individual Ataxin 2 Gene (ATXN2) Alleles With30 to 33 CAG Repeats Compared With Alleles With 23or Fewer CAG Repeats.

Data are shown for 30 (A), 31 (B), 32 (C), and 33 (D) CAG repeats relative to the baseline of 23 or fewer CAG repeats. Horizontal lines indicate 95% CI; arrow (D) indicates an off-scale 95% CI. Dashed line indicates the pooled OR, with the width of the diamond representing the 95% CI. Square size is representative of the size or weight of the individual study.
