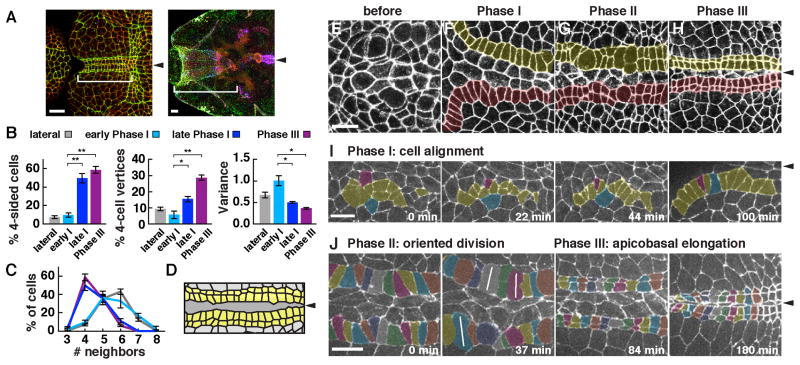
Figure 1. Spatiotemporally regulated cell alignment, division, and cell-shape change during square cell grid formation.
(A) Cells form a square cell grid (bracket) at the midline of the presumptive pharynx (left, stage 13), which ultimately forms the midline of the pharyngeal tube after involution (right, stage 15). Phosphotyrosine (green), β-catenin (red), and Par-3 (blue). (B,C) The percentage of 4-sided cells increased from 10±2% (mean±sem) in early Phase I to 59±4% in Phase III. The average number of neighbors decreased from 5.6±0.09 in early Phase I to 4.5±0.09 in late Phase I and 4.5±0.04 in Phase III. The percentage of 4-cell vertices significantly increased and the variance of the topological distribution significantly decreased in Phase III compared to early Phase I (p < 0.001, 4-cell vertices, p = 0.01, variance) or lateral cells in Phase III (p < 0.001, 4-cell vertices, p = 0.0002, variance) (unpaired t test). (D) Schematic of the square grid (yellow). (E–H) Wild-type embryos at stages 10 (E), 11 (F), 12 (G), or 13 (H) (β-catenin, white). (I,J) Stills from time-lapse movies of wild-type cells expressing β-catenin:GFP. (I) In Phase I (cell alignment, stage 11), rectangular cells align into rows on either side of the midline. (J) In Phase II (oriented division, stage 12), cells divide largely synchronously perpendicular to the midline. White lines, cells in anaphase or telophase. In Phase III (apicobasal cell elongation, stage 13), cells elongate along the apical-basal cell axis and midline cells delaminate from the epithelium, producing a compact square grid. t = 0 is the onset of Phase I (I) or the onset of the first division in Phase II (J). (n = 299–751 vertices in 86–398 cells in 4–7 embryos/stage) (*, p = 0.005 – 0.03, ** p < 0.005). Ventral views, anterior left. Arrowheads, ventral midline. Bars, 10 μm. See also Supplemental Movies 1 and 2.

