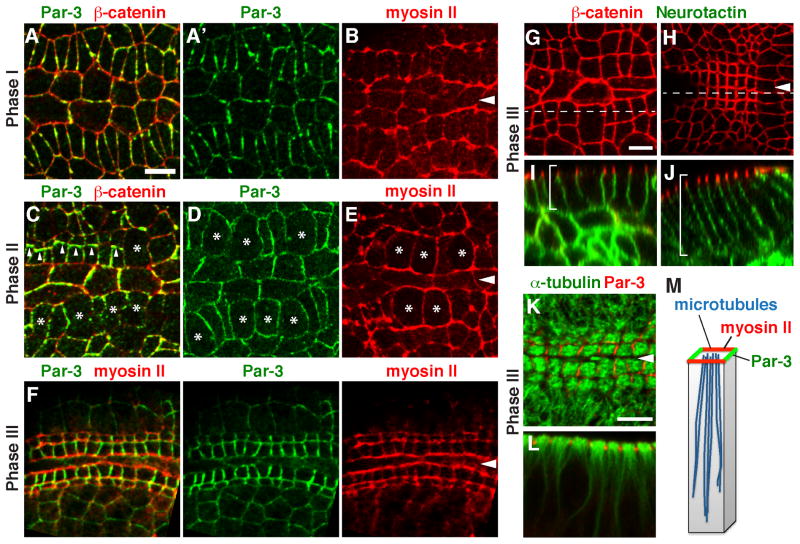
Figure 2. Square grid cells display planar polarized distributions of myosin II and Par-3.
(A–F) Localization of Par-3, β-catenin, and myosin II (Myosin:GFP) in wild-type embryos in Phase I (stage 11) (A, B), Phase II (stage 12) (C–E), or Phase III (stage 13) (F). Myosin II (red) is parallel to the midline in all three phases (B, E, and F). Par-3 (green) is perpendicular to the midline in Phases I (A) and III (F). Par-3 levels were transiently reduced at the cortex of dividing cells (asterisks) and transiently localized to new interfaces between daughter cells (arrowheads) in Phase II (C,D). (G–J) Cells undergo apicobasal elongation in Phase III (early Phase III, left; late Phase III, right). Brackets indicate the lateral cell membrane. (K and L) Microtubules align with the apical-basal axis in Phase III. (M) Schematic. Arrowheads, ventral midline. Bars, 5 μm. See also Figure S1.

