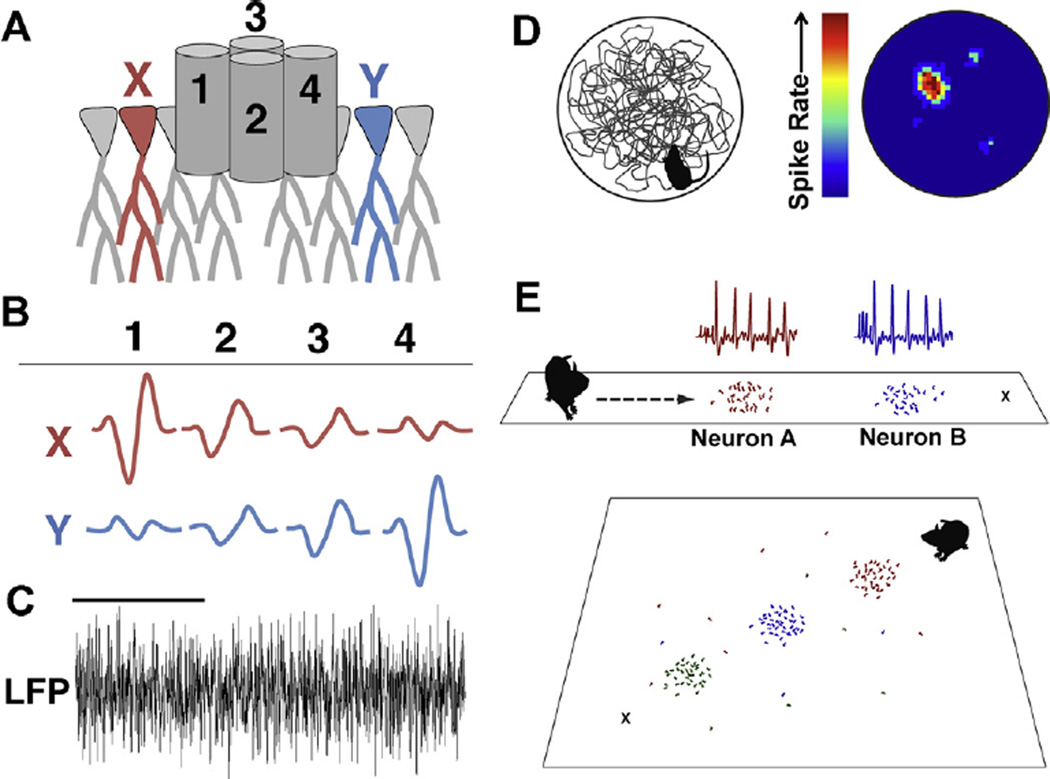
Fig. 4.
Single units (individual action potential discharge events) and LFPs reflecting population-level events can be measured in real time during arena exploration. (A)Typically, tetrodes are implanted so that the tips of the electrodes reside in the cell body layer of hippocampal area CA1. (B) Signals are high-pass filtered to observe the pattern of responses that individual action potentials produce on each electrode, permitting isolation of multiple distinct units (X and Y) by each tetrode. (C) One or more electrodes can be used to record population LFPs. Power scores can be calculated to determine the amount that any frequency or range of frequencies is represented in the population trace. Oscillatory rhythms in the range of 6–12 (theta) and 45–120 Hz (gamma) are often analyzed with respect to behavior of the animal. The example LFP is filtered at 3–140 Hz. Scale bar is one second. (D) The exploration path of an animal in a circular arena (left) shown with the heat map of discharge frequency for a single unit (right) reveals the place field of a single neuron. Firing rate increases when the animal occupies the place field and different units have different, but sometimes overlapping place fields. (E) During prospective encoding, neurons with established place fields (indicated by the colored dots on the linear maze and waveforms at top) fire transiently in advance of the animal’s movement and sweep from one place field (Neuron A) to the next (Neuron B) toward the animal’s destination (X) (Johnson and Redish, 2007). In a two-dimensional maze, neurons with established place fields (indicated by the colored dots) show prospective encoding by firing sequentially (red, blue, then green) toward the animal’s destination (X). Neurons sweep toward a home location (X) independent of the animal’s previous outbound path (Pfeiffer and Foster, 2013). (For interpretation of the references to color in this figure legend, the reader is referred to the web version of the article.)

