
Figure 3.
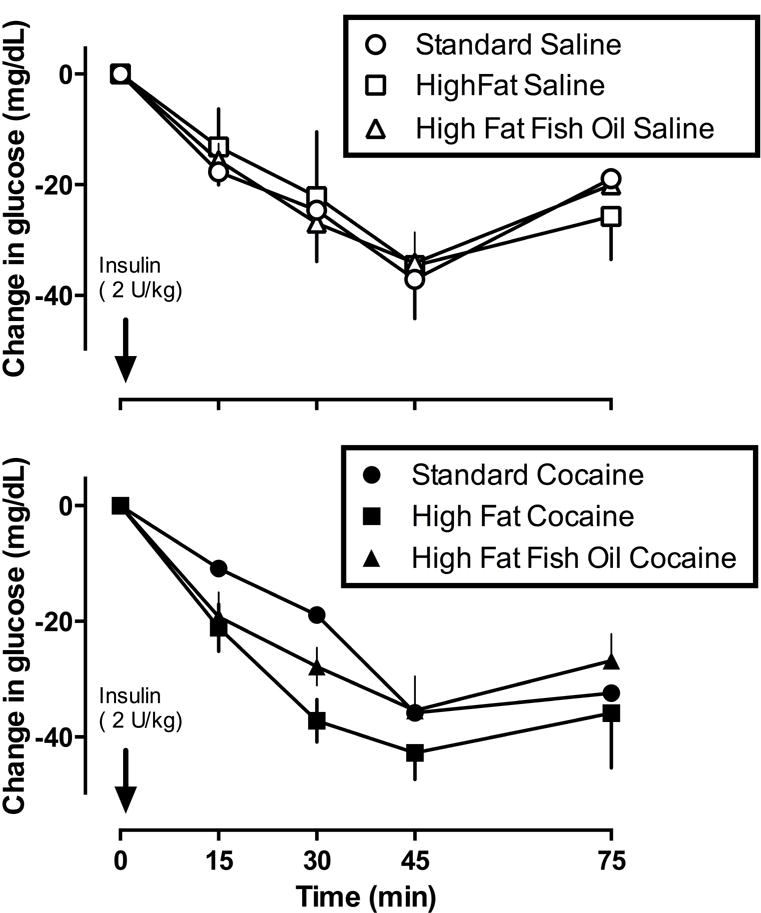
Change in blood glucose (mean ± 1 SEM, mg/dL; ordinate) determined during week 4 of the study after injection of 2 U/kg insulin in rats eating standard chow (circles), high fat chow (squares), or high fat chow with fish oil (triangles). Abscissae: time (min) after administration of insulin.