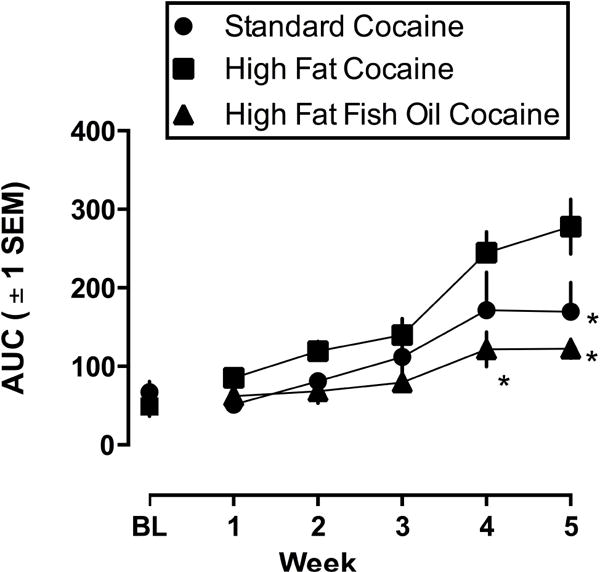
Figure 5.

Area under the cocaine dose-response curves (AUC) in rats eating standard chow (circles), high fat chow (squares), or high fat chow with fish oil (triangles) over 5 once weekly cocaine tests. Ordinate: mean (± 1 SEM) AUC. Abscissa: week in study. BL refers to the initial (baseline; top left panel, Figure 4) cocaine test when all rats were eating standard chow.
