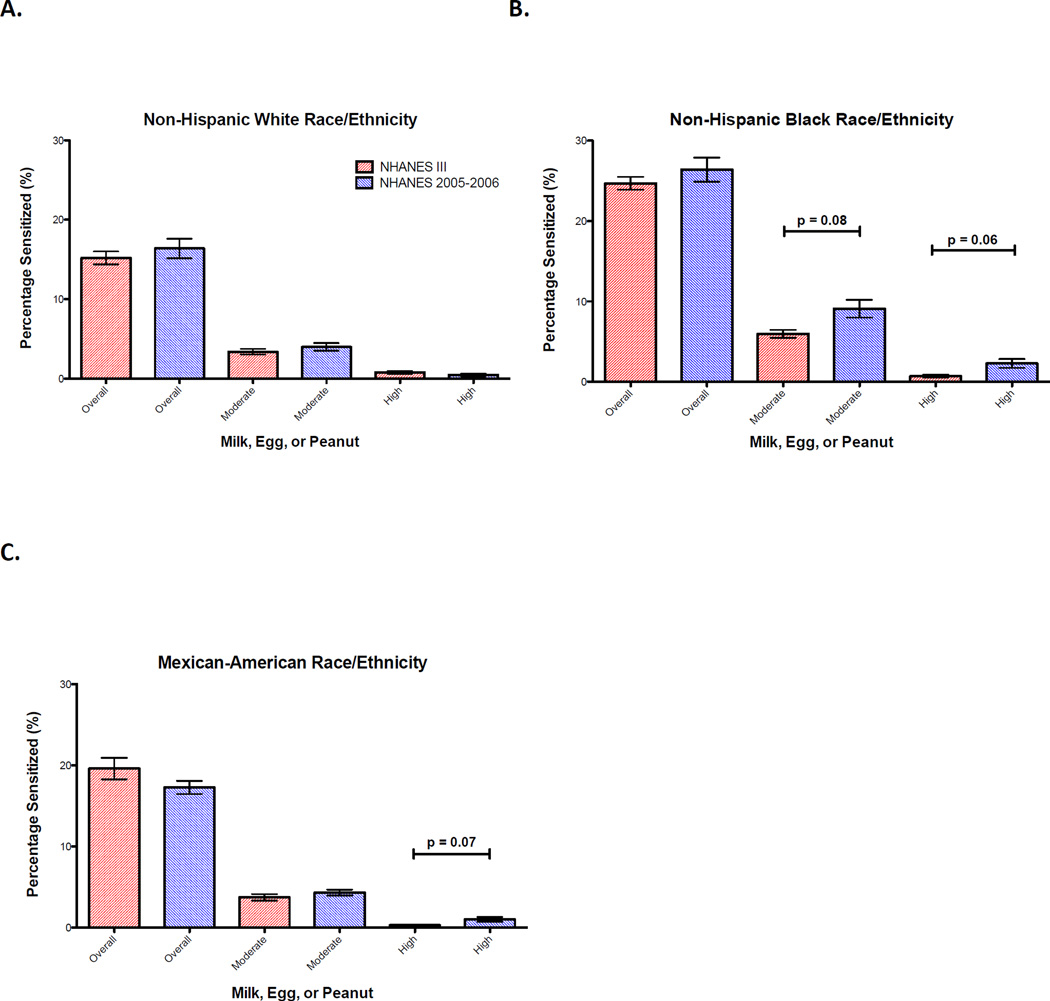
Figure 1. Trends in food sensitization over time by race/ethnicity.
Proportion of children ages 6–19 with overall, moderate-level, and high-level food-specific IgE levels to milk, egg, or peanut in NHANES III (red) and NHANES 2005–2006 (blue) by race/ethnicity. (A) Non-Hispanic White; (B) Non-Hispanic Black; (C) Mexican-American. Bars and whiskers represent 95% confidence intervals (CIs).

