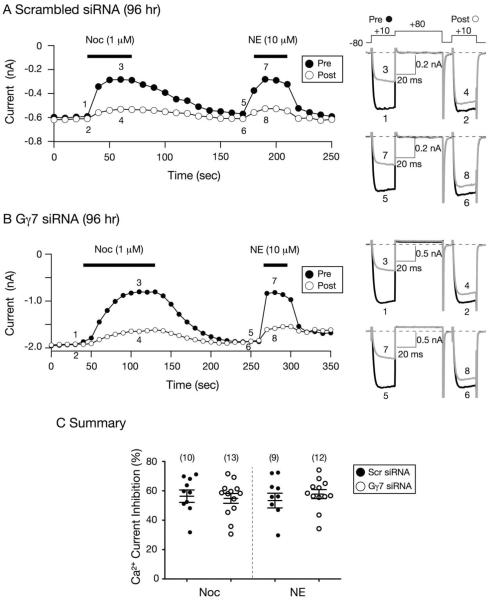
Figure 1. Effect of Gγ7 knockdown on the Noc- and NE-mediated Ca2+ current inhibition 96 hr post siRNA transfection.
A and B) Time courses of peak Ca2+ current amplitude inhibition for pre- (●) and postpulse (○) acquired from the sequential application of Noc (1 μM) and NE (10 μM) in neurons transfected with control scrambled (A) and Gγ7 (B) siRNA, respectively. Superimposed Ca2+ current traces evoked with the `triple-pulse' voltage protocol (shown on top of 1A, right) in the absence (1 and 2; 5 and 6, black) or presence (3 and 4; 7 and 8, grey) of Noc and NE, respectively, are shown to the right. Currents were evoked every 10 sec. The filled bars indicate the application of agonists. C) Summary dot plot of mean (± SE) Ca2+ current inhibition produced by application of Noc or NE in neurons transfected with control scrambled or Gγ7 siRNA. Inhibition was determined from the Ca2+ current amplitude measured isochronally at 10 msec into the prepulse (+10 mV) in the absence or presence of Noc or NE. Numbers in parenthesis indicate the number of neurons tested.

