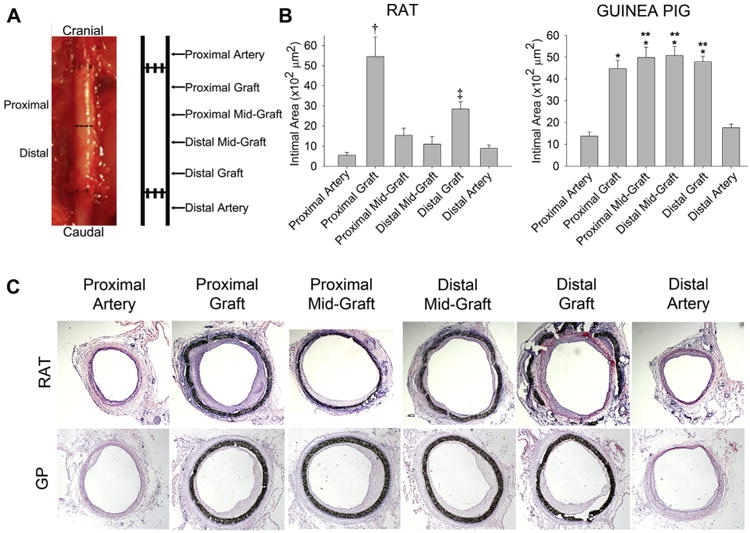
Fig 7.

Analysis of graft and artery intimal hyperplasia. A, Graft specimens explanted with 5 mm proximal and distal aorta 30 days after insertion were divided into proximal and distal segments, and intimal hyperplasia analyzed at six designated locations throughout the artery and graft. B, Intimal formation in the rat was greatest at the proximal graft (†P < .001 compared with the five other locations), followed by the distal graft (‡P < .04 compared with the proximal artery, distal midgraft, and distal artery). The guinea pig developed intimal hyperplasia similarly throughout the graft (*P < .001 compared with the proximal and distal artery). Comparing the two animal models, the guinea pig developed more intimal hyperplasia at the proximal midgraft, distal midgraft, and distal graft compared with the rat at those similar locations (**P < .001). The range bars show the standard error. C, Representative hematoxylin and eosin-stained cross sections (original magnification ×2.5) used for morphometric analysis.
