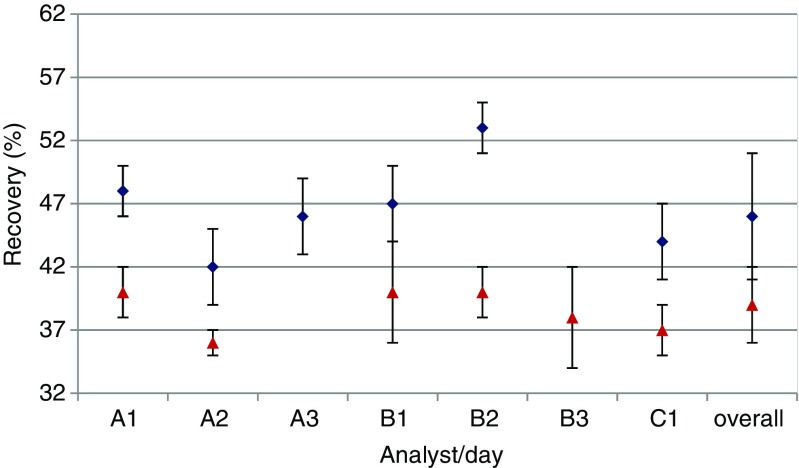
Fig. 1.
Blank cheese samples spiked with SEA at 0.1 ng/g (blue diamonds) and 0.25 ng/g (red triangles). Performance of analysts (A–C) over time (measurement days 1–3) and overall performances. The error bars represent the variability of the four independent analyses per analyst and day (24 independent data in case of the overall values)

