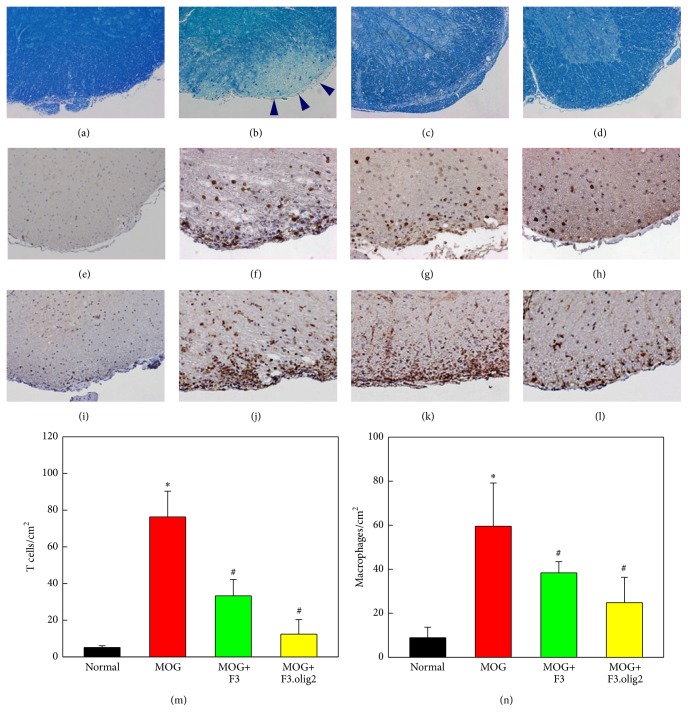
Figure 2.
Representative findings of the spinal cords stained with Luxol fast blue ((a)–(d)) and immunostained with CD3 for T cells ((e)–(h)) or Mac3 for macrophages ((i)–(l)) and the numbers of T cells (m) and macrophages (n). (a), (e), and (i): normal, (b), (f), and (j): myelin oligodendrocyte glycoprotein (MOG) alone, (c), (g), and (k): MOG+F3 cells, and (d), (h), and (l): MOG+F3.olig2 cells; arrowheads: demyelinated area. ∗Significantly different from normal control (P < 0.05). #Significantly different from MOG alone (P < 0.05).

