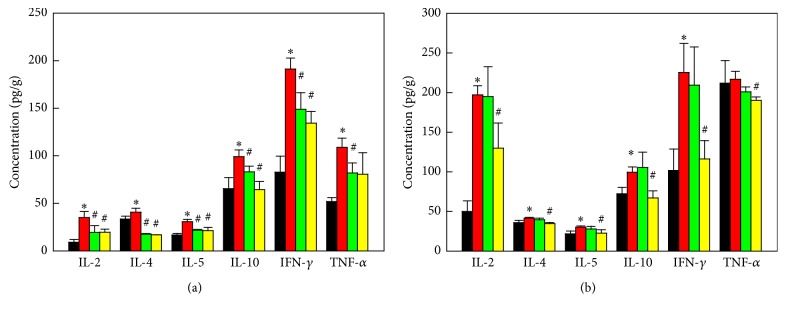
Figure 3.
Effects of F3 or F3.olig2 cell transplantation on the myelin oligodendrocyte glycoprotein- (MOG-) induced increase in the cytokines in the spinal cords (a) and lymph nodes (b). Black: normal, red: MOG alone, green: MOG+F3 cells, yellow: MOG+F3.olig2 cells, IL: interleukin, IFN-γ: interferon-γ, and TNF-α: tumor necrosis factor-α. ∗Significantly different from normal control (P < 0.05). #Significantly different from MOG alone (P < 0.05).

