Figure 3.
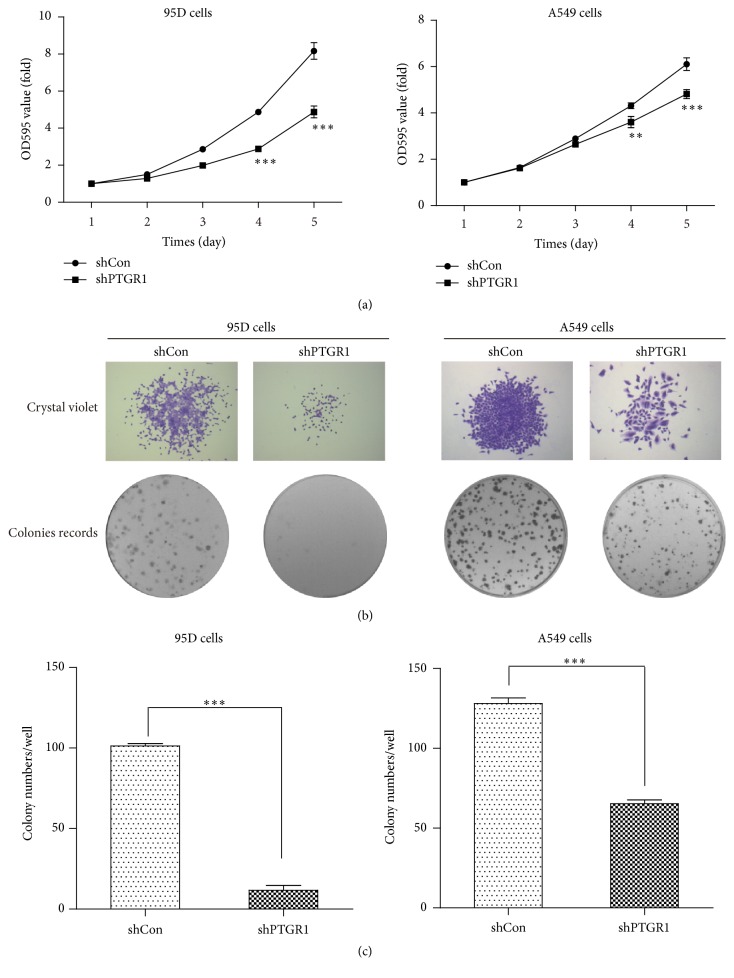
shPTGR1 inhibited the proliferation of 95D and A549 cells. (a) The growth curve in 95D/shPTGR1 and A549/shPTGR1 was lower than in 95D/shCon and A549/shCon cells. (b) Images recorded under micro and macro view, representing the size and the number of colonies in each group of cells. All data represented as mean value ± SD from 3 independent experiments. (c) Statistical analysis revealed that the number of colonies in 95D/shPTGR1 and A549/shPTGR1 was lower than in 95D/shCon and A549/shCon cells. ∗∗ p < 0.01; ∗∗∗ p < 0.001.

