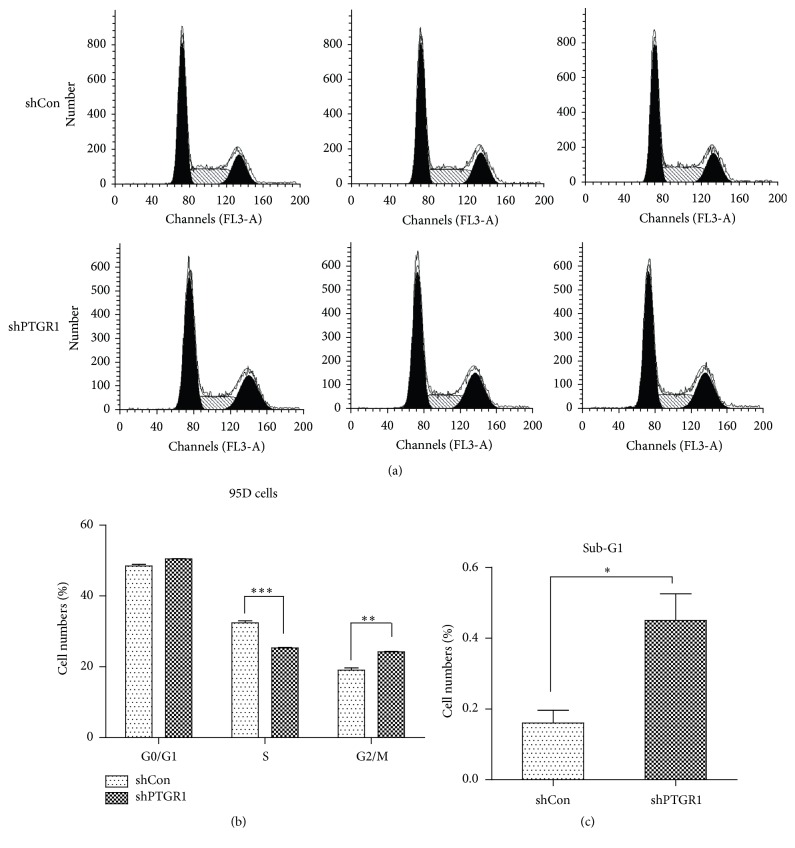
Figure 4.
shPTGR1 inhibited the cell cycle progress of 95D cells. (a) FACS analyses of cell cycle distribution in 95D cells. A hypodiploid apex representing the apoptotic cells was found before the G1 apex in 95D/shPTGR1. (b) Downregulation of PTGR1 in 95D cells led to an increase of cells at G2/M phase and concomitantly a decrease of cells at S phase. (c) Downregulation of PTGR1 in 95D cells led to an increase of cells at sub-G1 phase. Data represents means ± SD from 3 independent experiments. ∗ p < 0.05; ∗∗ p < 0.01; ∗∗∗ p < 0.001.

