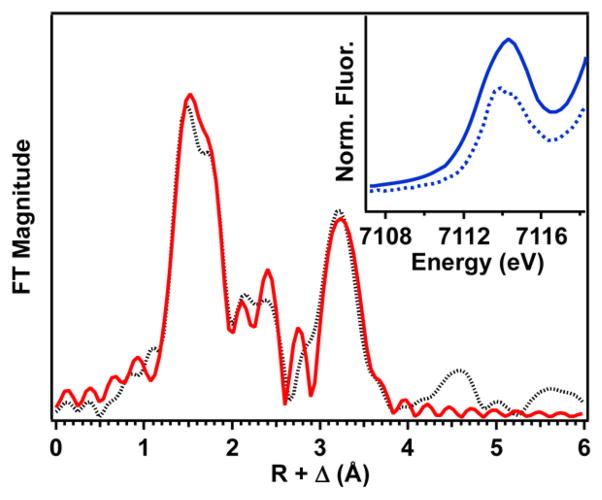
Figure 2.
Fourier transform of the Fe K-edge EXAFS data for 1a over a k range of 2–14.5 Å−1 (the black dotted line is experimental data; the solid red line is the best fit with one O scatterer at 1.74 Å, four N scatterers at 2.17 Å, and one Sc scatterer at 3.69 Å). The inset compares the pre-edge features of 1a (solid line) and [FeIII(η1-OOH)(TMC)]2+ (dotted line).

