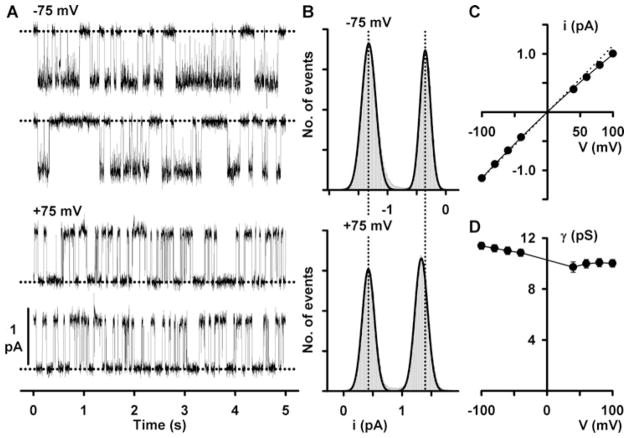
Fig. 27.1. Effect of voltage on the single-channel activity of CFTR.
(a) Representative recordings of a single CFTR Cl− channel at −75 mV (top) and +75 mV (bottom) in an excised inside-out membrane patch. The membrane patch was bathed in symmetrical 147 mM NMDGCl solutions, and ATP (1 mM) and PKA (75 nM) were continuously present in the intracellular solution. Dotted lines indicate the closed channel state. Downward and upward deflections correspond to channel openings at −75 and +75 mV, respectively. Each trace is 10 s long. (b) Single-channel current amplitude histograms of a single CFTR Cl− channel at the indicated voltages. At −75 mV (top), the closed channel amplitude is shown on the right, whereas at +75 mV (bottom), the closed channel amplitude is shown on the left. The continuous lines represent the fit of Gaussian distributions to the data. The vertical dotted lines indicate the positions of the open and closed levels at −75 mV. (c) Single-channel I–V relationship of CFTR. Data are means ± SEM (n = 10); error bars are smaller than symbol size. The dotted line shows the I–V relationship of an ion channel with ohmic behaviour. (d) Relationship between chord conductance and voltage for the data shown in (c). For further information, see Cai et al. (25). Modified from The Journal of General Physiology 2003, 122:605–620. Copyright 2003 The Rockefeller University Press.

