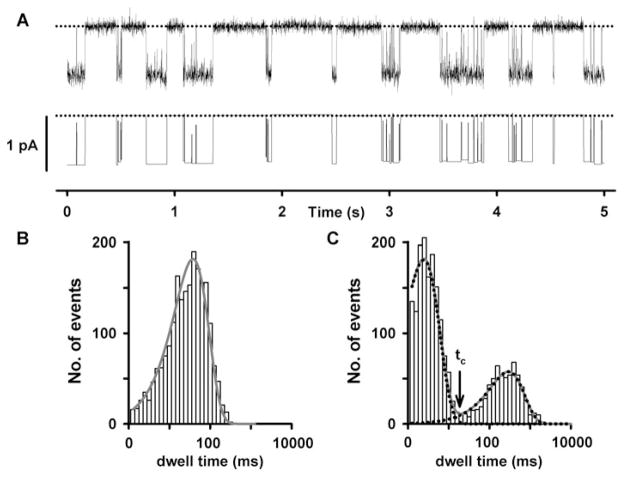
Fig. 27.2. Dwell-time analysis of a single CFTR Cl− channel.
(a) Representative recording of a single wild-type human CFTR Cl− channel (top) and its corresponding idealized record (bottom). Dotted lines indicate where the channel is closed and downward deflections correspond to channel openings. For further information, see Cai et al. (37). (b, c) Representative open and closed dwell-time histograms, respectively. For the open-time histogram (b), the continuous line is the fit of a one-component exponential function. For the closed dwell-time histogram, the continuous line is the fit of a two-component exponential function. Dotted lines show the individual components of the exponential functions. The vertical arrow indicates the delimiter time (tc) that separates interburst closures from intraburst closures.

