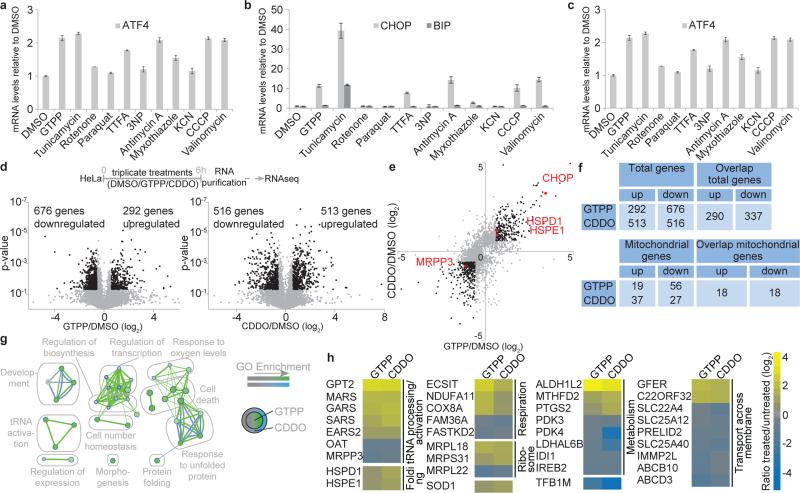
Fig. 1. Global analysis of transcriptional responses to UPRmt induction.
a-c, qPCR of HSPD1 (a), CHOP and BIP (b) or ATF4 (c) mRNA in HeLa cells with or without the indicated treatments (mean of levels relative to untreated ±s.d.; n=3 biological replicates). d, Experimental design (top). Volcano plot showing fold changes versus p-values for the analyzed transcriptome of cells treated with GTPP (bottom left) or CDDO (bottom right). Proteins significantly changing upon MTUPR induction (p≤0.05, changes ≥ log2 ±0.6) are represented by black dots. e, Correlation of ratios of transcripts changing upon GTPP or CDDO treatment. Black dots, p≤0.05, changes ≥ log2 ±0.6; Red dots, genes of interest. f, Summary of altered transcripts. g,h, GO enrichment map (d) and heat map (e) of overlapping mitochondrial transcripts altered by both GTPP and/or CDDO.

