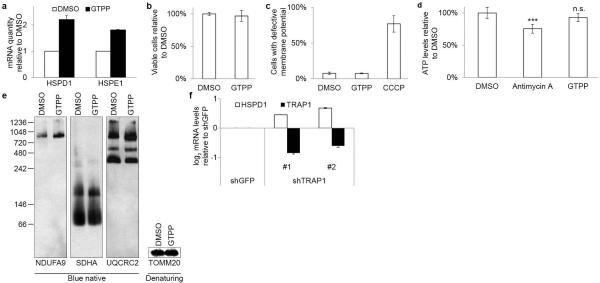
Extended Data Figure 1. Mitochondrial HSP90 inhibition induces UPRmt.
a, Quantitative PCR monitoring chaperonin (HSPD1 and HSPE1) mRNA levels upon treatment of cells with GTPP. Shown are means of levels relative to untreated ±s.d. (n=3 biological replicates). b, Measurement of cell viability upon GTPP treatment with CCK8. Shown are means of levels relative to untreated ±s.d. (n=5 biological replicates). c, Measurement of mitochondrial membrane potential upon GTPP or CCCP (mitochondrial membrane potential uncoupler) treatment, measured with JC-1 and analyzed on a BD FACSCalibur. Shown are means of levels relative to untreated ±s.d. (n=3 biological replicates). d, Measurement of cellular ATP levels upon GTPP or antimycin A (electron transport chain inhibitor) treatment. Shown are means of levels relative to untreated ±s.d. (n=4 biological replicates) and two-tailed p-values ***p≤0.001, n.s. not significant. e, Blue native gel analysis of mitochondrial respiratory chain complexes upon 6 h treatments of DMSO or GTPP. f, Changes in chaperonin and TRAP1 mRNA levels upon knockdown with shRNA targeting GFP or TRAP1 mRNA. Shown are means of log2 fold changes relative to control and standard deviation (n=3 biological replicates).

