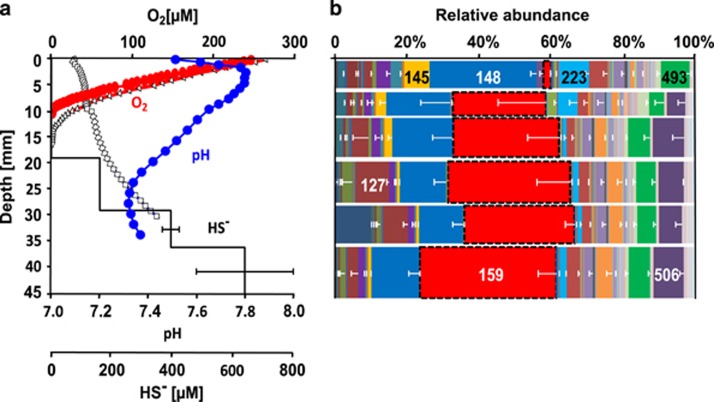
Figure 1.
Geochemical gradients and microbial community analysis from a representative incubation of sediments taken from the Flingern aquifer. (a) Porewater profiles of O2, pH and HS− of homogenized sediment amended with 2 μmol g−1 sediment after 70 days of incubation in the dark. One typical replicate out of four is shown. Error bars for sulfide concentrations in different slices of the cut sediment represent s.d.'s of three technical replicates. Open symbols show pore water profiles of O2 (triangles) and pH (squares) of one typical abiotic control column out of two. (b) Corresponding depth-resolved relative abundance of T-RF 159 (dashed frame) representing members of the Desulfobulbaceae as the mean values of three independent DNA extractions. Error bars show s.d.'s of relative abundances determined from triplicate DNA extractions of one typical replicate out of two.

