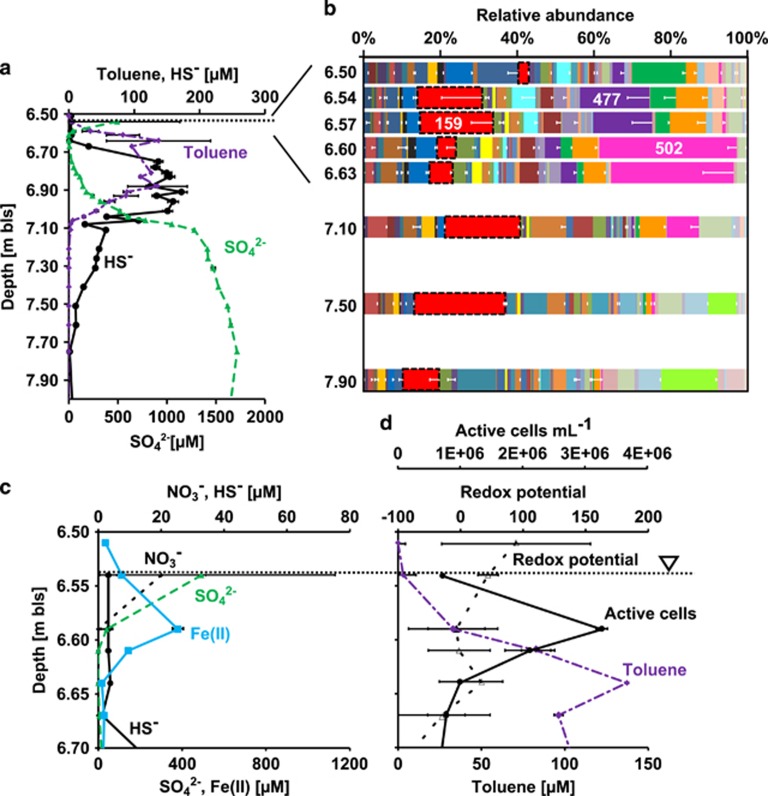
Figure 3.
Depth profiles of geochemistry of water samples from a high-resolution monitoring well installed in Flingern and of microbial community compositions from a sediment core drilled at 1 m distance. (a) Groundwater chemistry of duplicate measurements showing the zone of toluene contamination as well as the sulfide- and sulfate concentrations. (b) T-RFLP microbial community fingerprints obtained from triplicate DNA extractions of different sediment layers. T-RF 159 (dashed frame) is representing members of the Desulfobulbaceae. Data show the mean values and s.d.'s of three independent DNA extractions. (c, d) Geochemistry and active cell densities estimated from intracellular ATP concentrations of groundwater at the upper plume fringe. Bls, below land surface. The dashed horizontal lines indicate the groundwater table.

