
Figure 6.
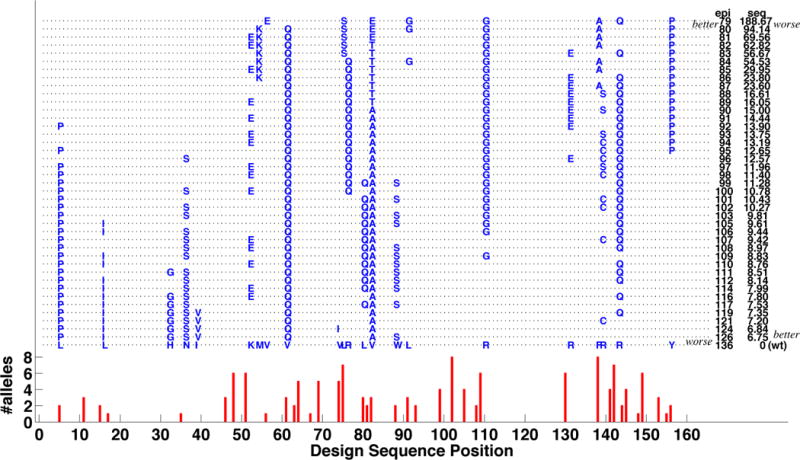
Mutation profile for Pareto frontier of Epo 8-mutation designs. Each design is represented as a dashed line marked with mutations; the bottom row shows the corresponding wild-type residues. Designs are ranked from top to bottom as increasing epitope score and decreasing sequence score (values are on the right). The wild-type epitope profile is provided at the very bottom, with red bars indicating the number of alleles for each starting 9-mer position.