
Fig. 1.
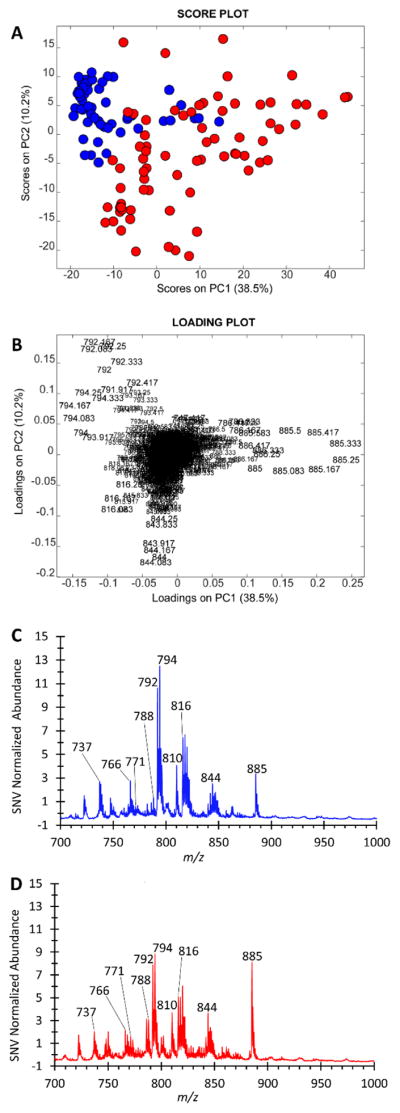
Negative ion mode TS-MS results from the kidney surgical cases. A) PCA score plot of the TS-MS data. Each object represents a separate sampling-ionization event from the freshly resected tissue. Healthy renal tissue is blue, RCC is red. A total of 18 human subjects are represented, with 16 RCC and 13 healthy renal tissue specimens, respectively. The average sampling events per tissue is five. B) Corresponding PCA loading plot showing that m/z 792 ([PC 34:2 + Cl]−), 794 ([PC 34:1 + Cl]−), 844 ([PC 38:4 + Cl]−), and 885 ([PI 38:4 - H]−) are the major contributors to the separation observed in A. C and D) Average mass spectra of the normal and tumor classes, respectively. The SNV normalized signal intensity is plotted in the average spectra.