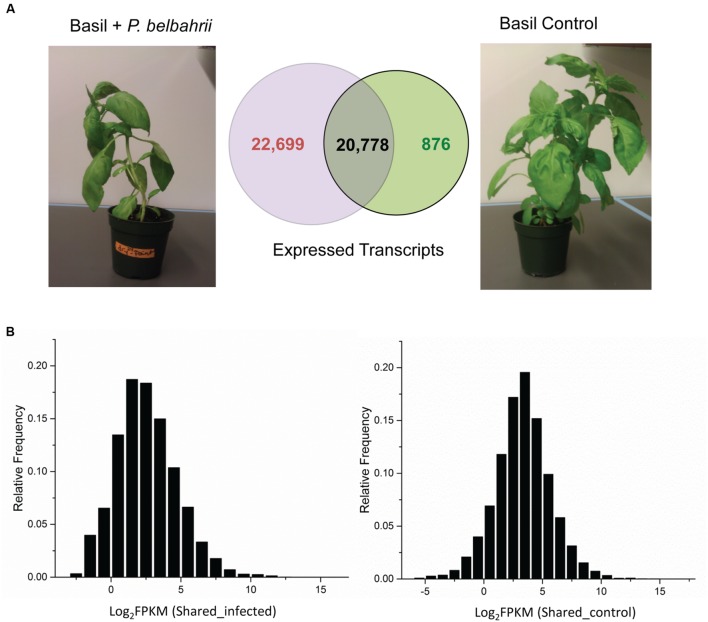
FIGURE 2.
Transcript comparison between control and infected plants. (A) Total number and overlap between transcripts discovered in infected sweet basil 5 dpi (Basil + Peronospora belbahrii) and uninoculated plants (Basil Control). (B) Distribution of the base 2 logarithm of FPKM (fragment per kilobase of exon per million fragments mapped) for shared transcripts under infected (left) and control (right) conditions. Note that shared transcripts (plant genes) have a higher (approximately twice as much) average read coverage in the control condition compared to the infected condition.

