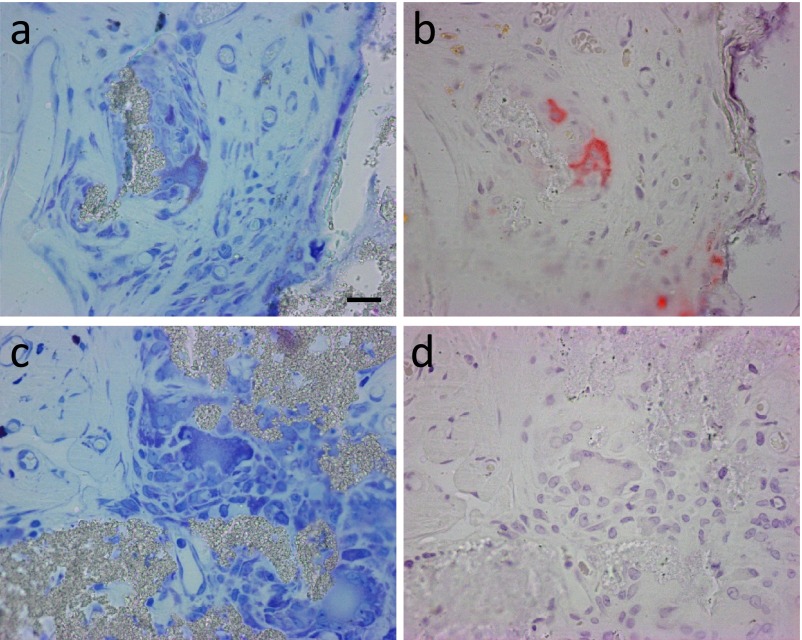
Fig. 6.
Characterization of TRAP-positive and TRAP-negative MNGCs. Sets of serial sections (a, b and c, d) stained with Giemsa solution (a, c) and analyzed for TRAP activity (b, d). (a, b) are larger magnification images of MNGCs in Figure 5 (a, b), and (c, d) are larger magnification images of MNGCs in Figure 5 (e, f). In the specimen implanted with β-TCP granules with BMMCs, MNGCs near bone exhibit potent TRAP activity (b), whereas MNGCs in the region without bone formation do not possess TRAP activity. Bar=20 μm.

