Figure 1.

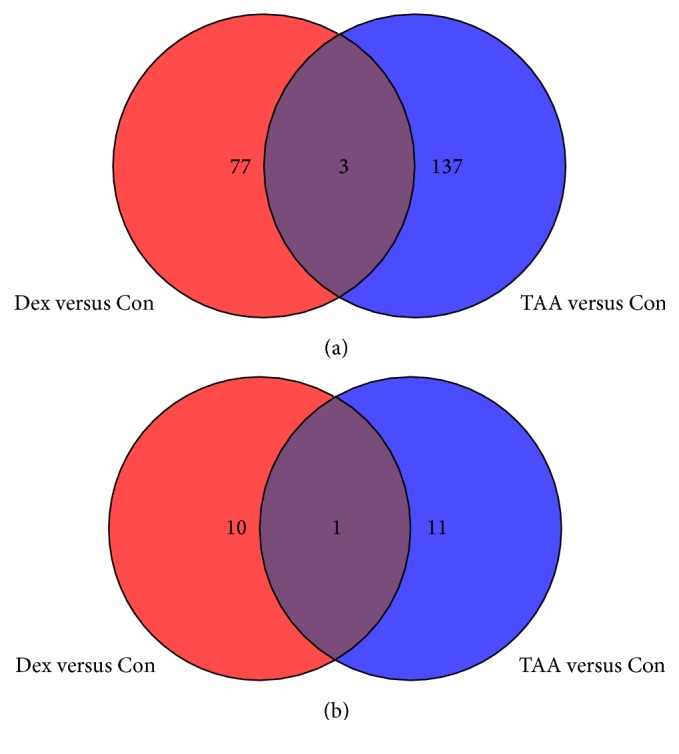
Venn diagram detailing the number of genes in each category. (a) One-week postinjection time point for fold change (FC) > 1.5, p < 0.05. (b) One-month postinjection time point for FC > 1.5, p < 0.05.

Venn diagram detailing the number of genes in each category. (a) One-week postinjection time point for fold change (FC) > 1.5, p < 0.05. (b) One-month postinjection time point for FC > 1.5, p < 0.05.