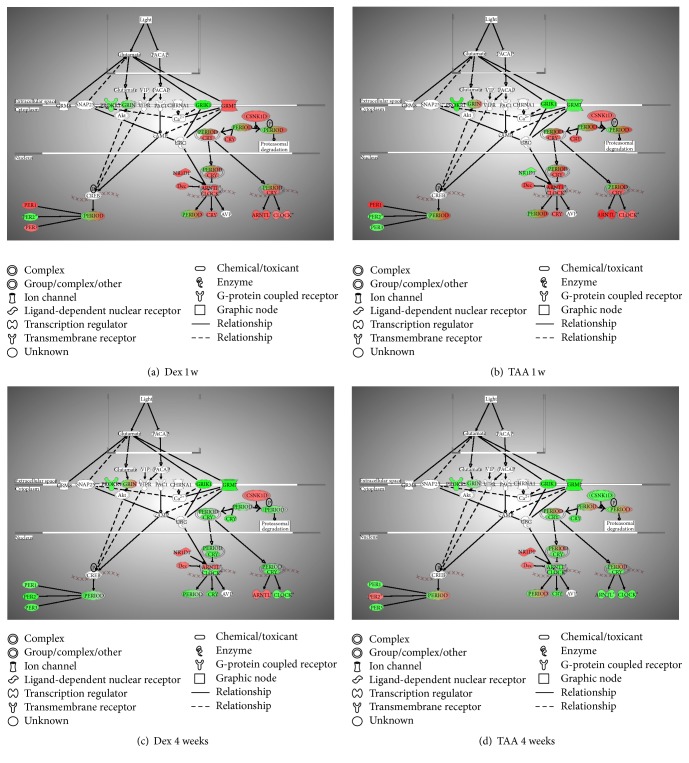
Figure 4.
Represented is the canonical pathway “Circadian Rhythm Signaling” overlaid with the expression data from the following: (a) DEX versus Con at 1 week, (b) TAA versus Con at 1 week, (c) DEX versus Con at 1 month, and (d) TAA versus Con at 1 month postinjection. Data is represented as fold change of sample to control, p < 0.05 from ANOVA analysis. Red color means upregulation, while green means downregulation of the gene expression.

