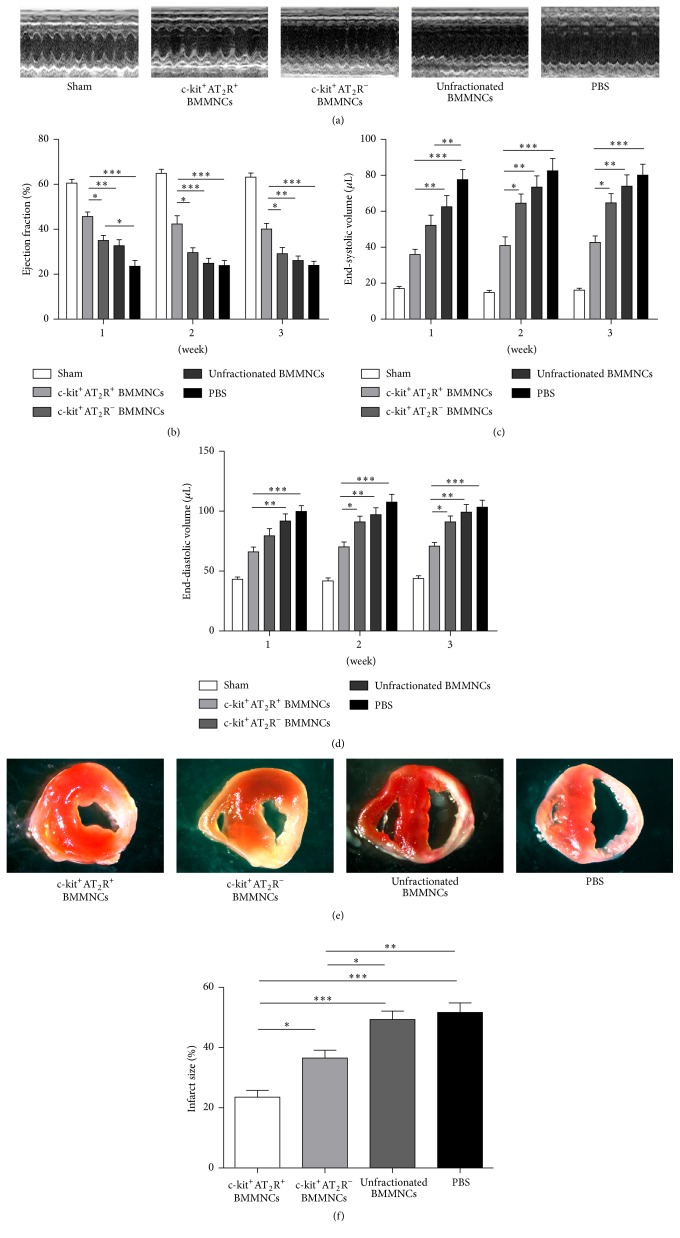
Figure 6.
Echocardiographic evaluation: (a) M-mode images showing cardiac function. (b) Ejection fraction, (c) end-systolic volume, and (d) end-diastolic volume (∗ p < 0.05, ∗∗ p < 0.01, and ∗∗∗ p < 0.001; n = 6 for each group). (e) TTC staining of transverse sections and quantification of infarct size of each group (∗ p < 0.05, ∗∗ p < 0.01, and n = 6 for each group).

