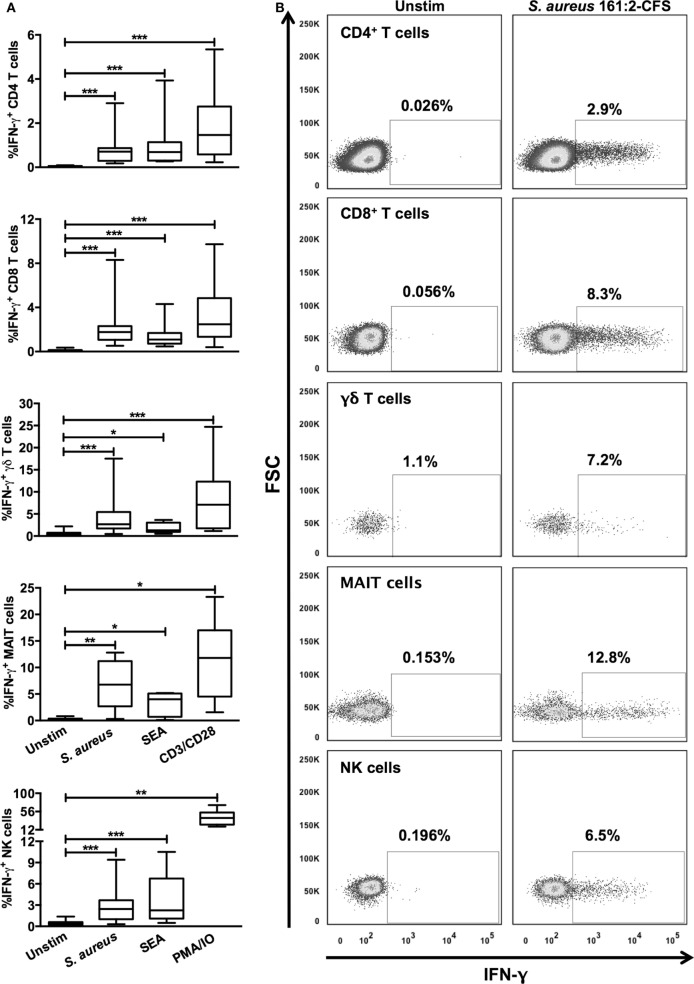
Figure 2.
S. aureus 161:2 induces IFN-γ expression in T cells and NK cells. PBMC were stimulated as indicated and analyzed by flow cytometry. (A) The percentage of IFN-γ+ cells among the CD4+ (n = 12–17), CD8+ (n = 12–18), γδ TCR+ (n = 7–15), CD161+Vα7.2+ (n = 6–7), and CD3−CD56+ (n = 8–17) lymphocyte populations is shown. (B) Examples of IFN-γ stainings of the cell populations described in (A). Boxes cover data values between the 25th and 75th percentiles, with the central line as median and error bars showing minimal and maximal values.

