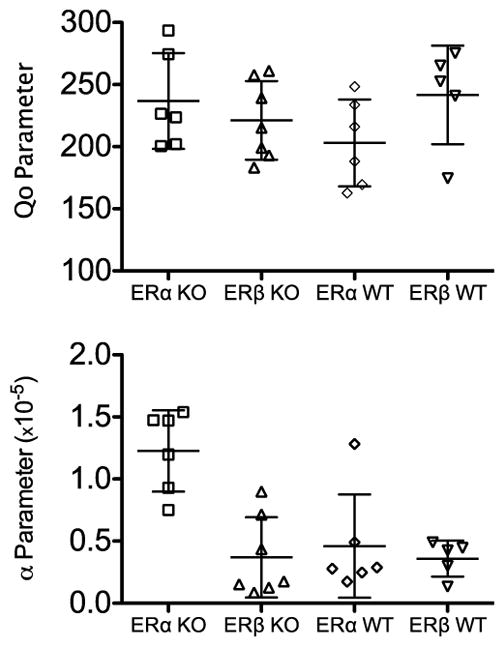
Fig. 2.

Parameter values obtained from the exponential demand equation fits to the data for the four groups of mice, shown across the x-axis. Each data point represents an individual mouse, and the error bars represent the standard deviation from the mean. Note the truncated y-axis in the top panel.
