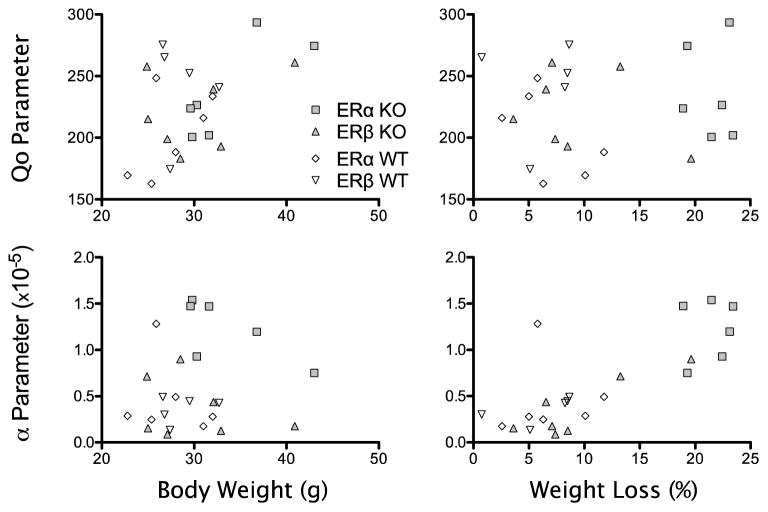
Fig. 4.
Scatterplots showing the relation between the parameters from the exponential demand equation and body weight (left panels) and percent weight loss (right panels). Each data point represents and individual mouse, and each group of mice is represented by a different symbol. Note truncated y-axes in top panels and truncated x-axes in left panels.

