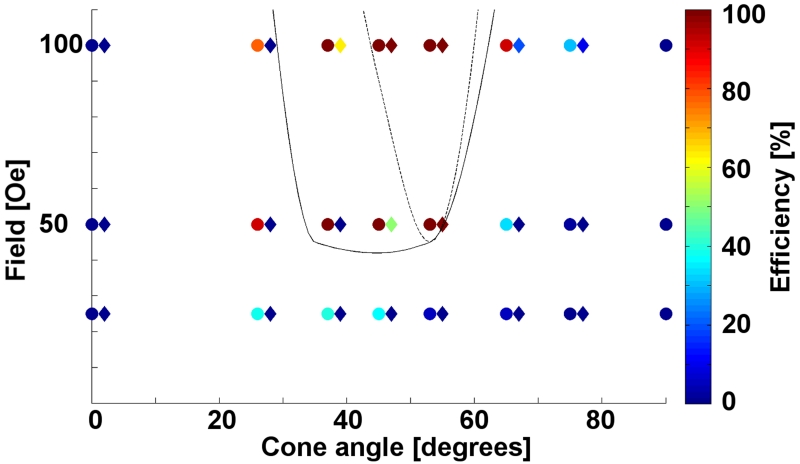
Figure 9.
The field vs. cone angle phase diagram on the drop-shape pattern is shown for 5.6-μm diameter particles (diamonds) and 8.4-μm diameter particles (circles). The boundaries of the conducting and non-conducting regimes for particles are represented with a dotted line and a solid line for the 5.6-μm and 8.4-μm diameter particles, respectively. A window appears around α = 30-50° where the 8.4-μm diameter particles can be transported across the substrate, whereas the 5.6-μm particles cannot.

