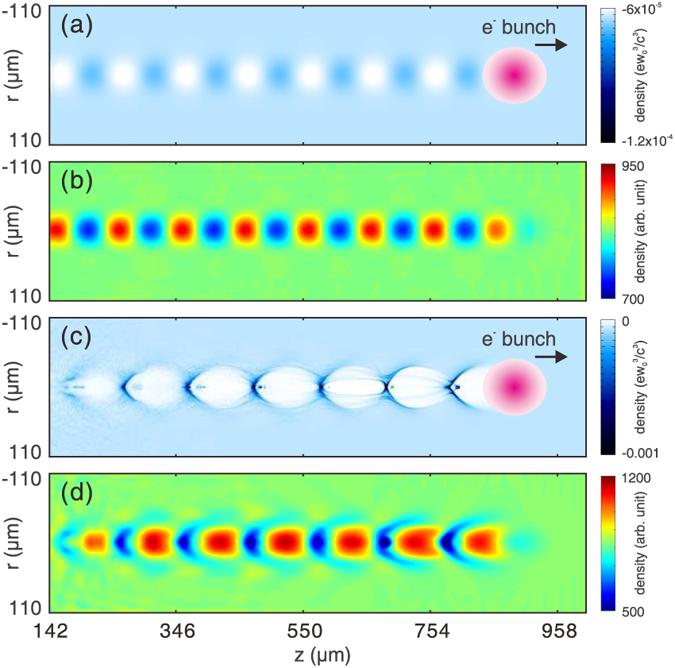
Figure 2. Snapshots of wakefield.

(a) shows the plasma density map of a linear wake and (b) shows the corresponding electron probe snapshot. (c,d) show the plasma density map and electron probe snapshot for a nonlinear wake respectively. The electron drive bunches that drive the wakes are also shown in (a,c).
