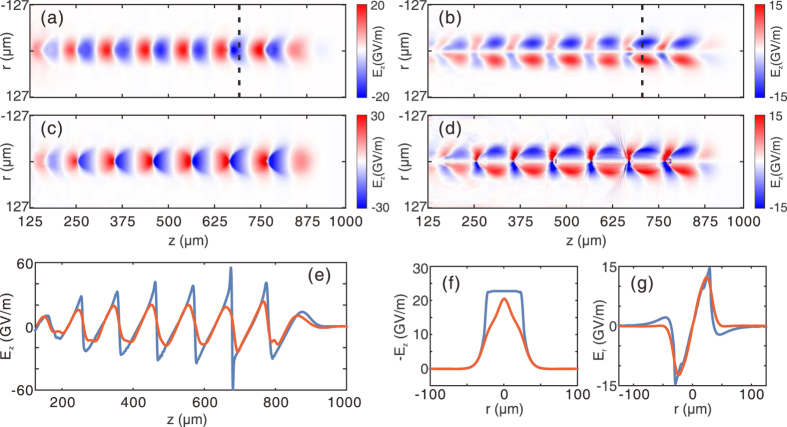
Figure 4. Reconstruction of a nonlinear wakefield.
(a,b) are the reconstructed Ez and Er fields respectively for a nonlinear wake. The corresponding probe density map is shown in Fig. 2(d). The simulated Ez and Er fields are shown in (c,d), respectively. Axial lineouts of Ez are shown in (e), where the red solid line represents the reconstructed field and the blue solid line is for the simulated field. In (f,g), the transverse lineout of Ez and Er are shown, with the same color definition as in (e).

