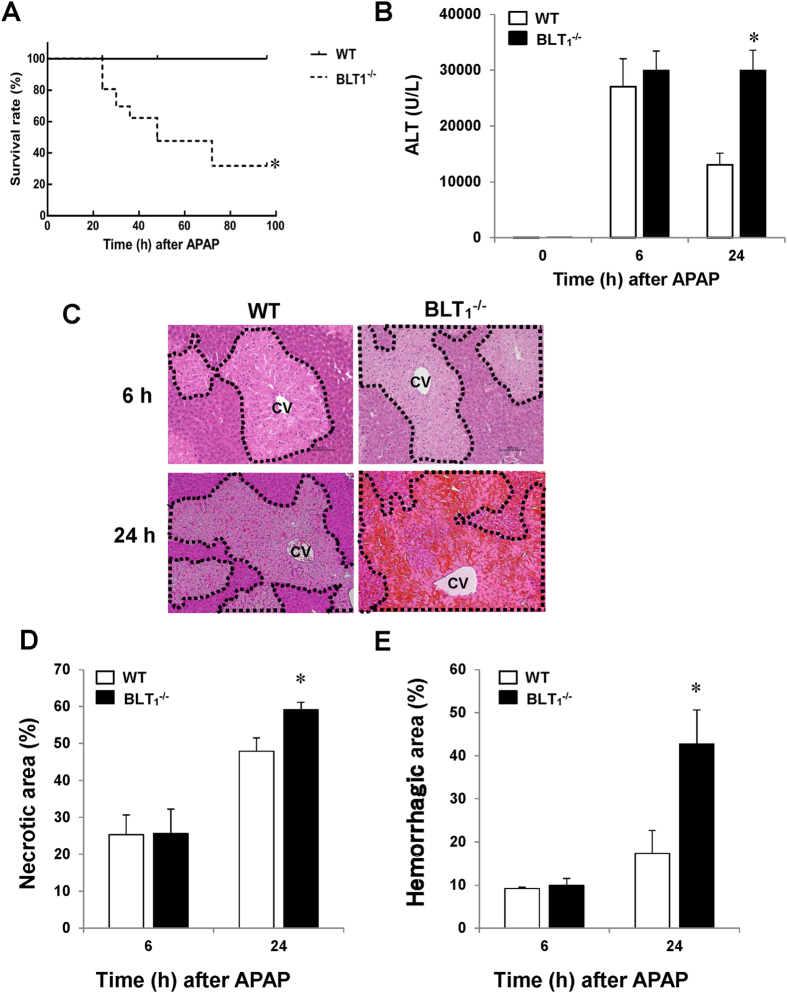
Figure 1. BLT1 signalling deficiency exacerbates APAP-induced mortality and liver injury in mice.
BLT1−/− mice and their WT littermates were administered APAP (300 mg/kg) by i.p. injection. (A) The survival rates of BLT1−/− mice (n = 20) and WT mice (n = 20) at various time points after receiving APAP. (B) Serum levels of ALT after APAP administration. Data are expressed as the mean ± SEM of six mice per group. *p < 0.05 vs. WT mice. Serum samples at 0, 6 and 24 h after APAP administration were collected for measurement of ALT levels. (C) Typical appearance of liver tissues stained with H&E in WT and BLT1−/− mice at 6 and 24 h after APAP injection (scale bar = 100 μm). The area surrounded by the black dotted line indicates the centrilobular necrotic area. CV, central vein. (D) The percentage of the hepatic necrotic area after APAP administration. Data are expressed as the mean ± SEM of six mice per group. *p < 0.05 vs. WT mice. (E) The percentage of the haemorrhagic necrotic area after APAP administration. Data are expressed as the mean ± SEM of six mice per group. *p < 0.05 vs. WT mice.

